5. Geometry
- 5-1. Basic Figure Drawing and Analysis Operations
- 5-2. Drawing a Freehand Figure
- 5-3. Drawing a Line Segment
- 5-4. Drawing a Circle
- 5-5. Drawing a Polygon
- 5-6. Adding Points on an Existing Line
- 5-7. Constructing Perpendicular Lines
- 5-8. Constructing a Center Point
- 5-9. Measuring the Length of a Line Segment
- 5-10. Measuring an Angle
- 5-11. Using Measurement Values in a Calculation
- 5-12. Making Two Lines Parallel
- 5-13. Making Two Lines Perpendicular
- 5-14. Selecting a Figure
- 5-15. Moving a Figure
- 5-16. Deleting a Figure
- 5-17. Draw History
- 5-18. Zooming the Draw Area
- 5-19. Panning the Draw Area
- 5-20. Configuring Draw Area Settings
- 5-21. Displaying an Image in a Geometry Sticky Note
- 5-22. Using the Protractor
- 5-23. Locking a Point
- 5-24. Using Trace
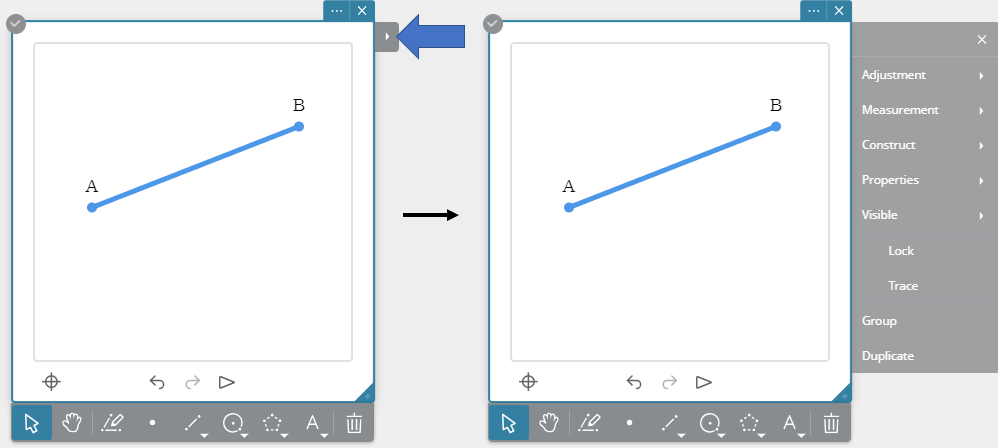
- 5-25. Configuring Figure Property Settings
- 5-26. Hiding a Figure
- 5-27. Grouping Figures
- 5-28. Duplicating a Figure
- 5-29. Drawable Figures
- 5-30. Adjustment Functions
- 5-31. Measurement Functions
- 5-32. Construction Functions
5-1. Basic Figure Drawing and Analysis Operations
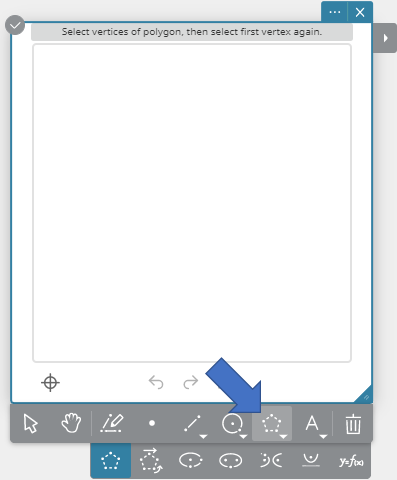
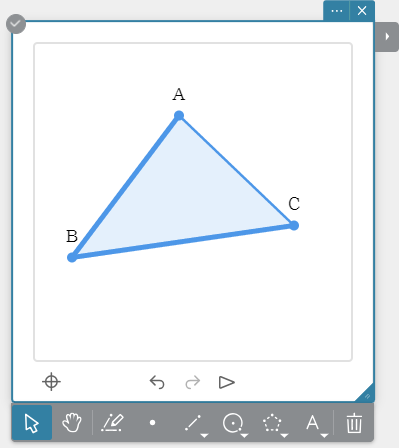
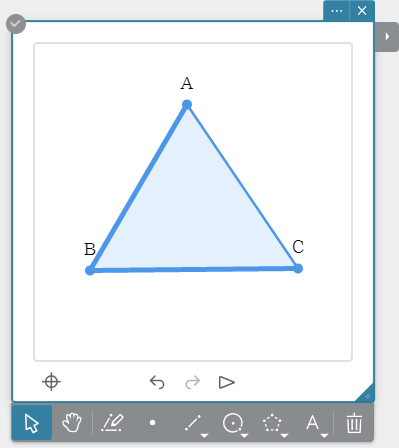
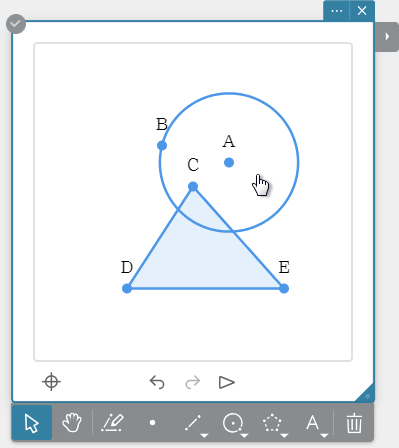
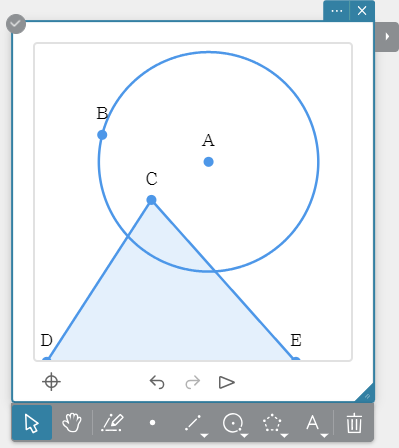
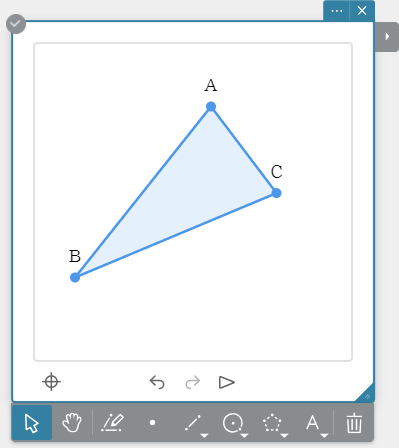
5-1-1. To draw a triangle
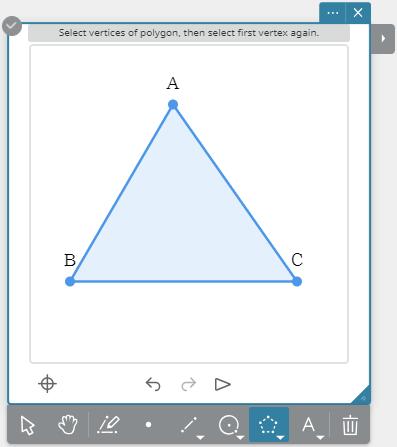
1. Click anywhere on the Paper.
• This displays the Sticky Note menu.
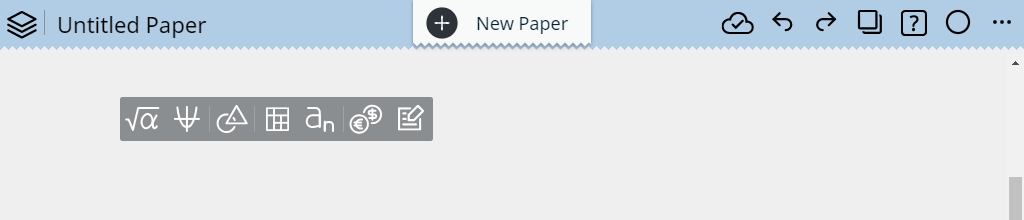
2. Click  .
.
• This creates a Geometry Sticky Note.
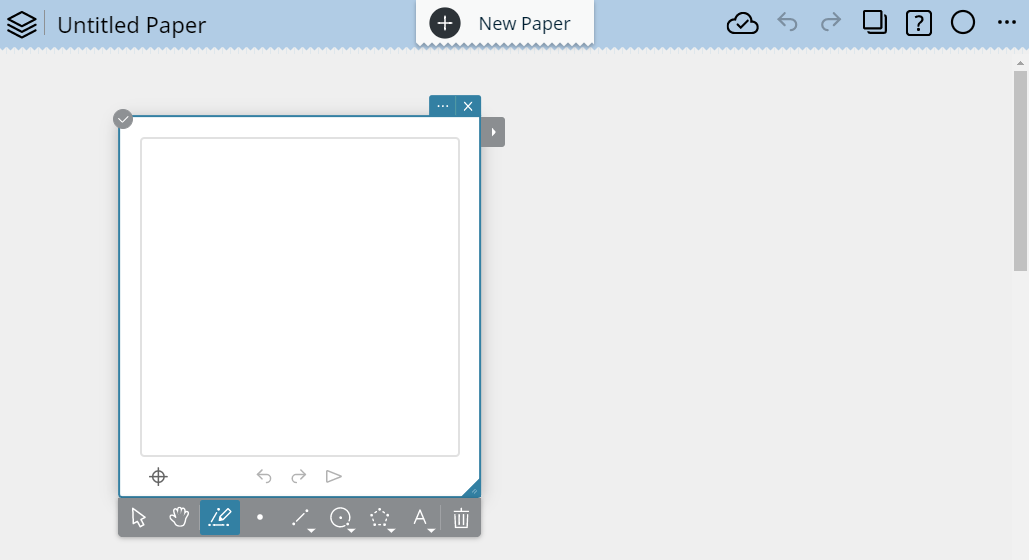
3. On the tool palette, click  .
.
• This displays the Object menu.
4. On the Object menu, click  .
.
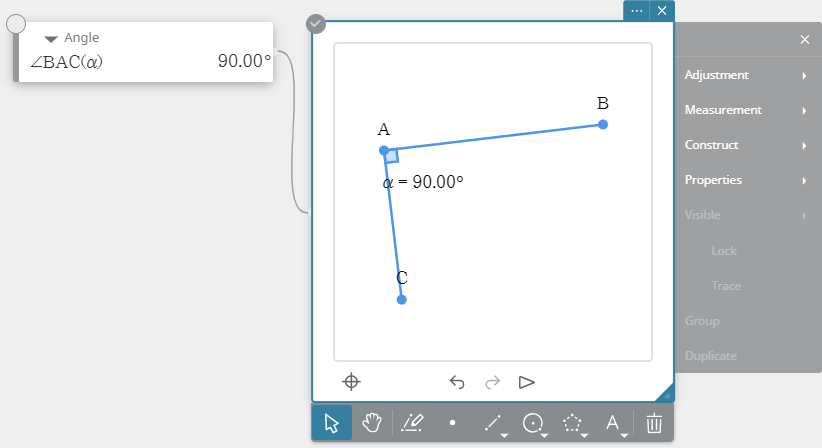
5. Click the three locations you want to specify as the vertices of the triangle.
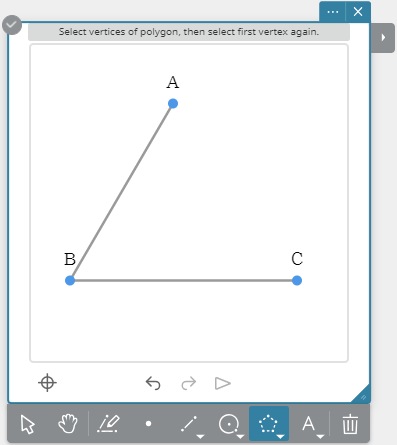
• The points you click are labeled (A, B, C, etc.) automatically.
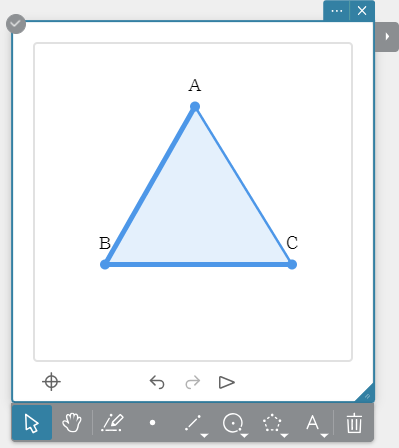
6. Click the first vertex you created.
• This will draw a triangle.
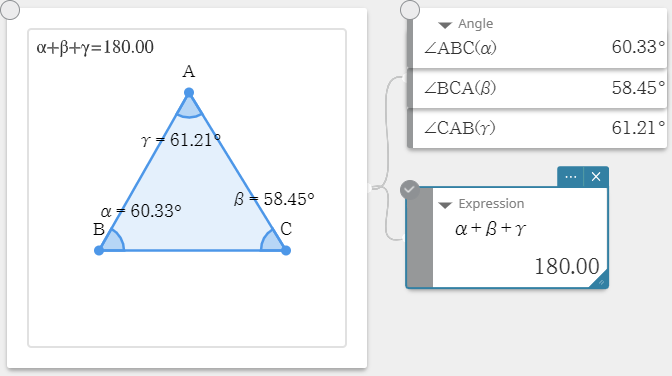
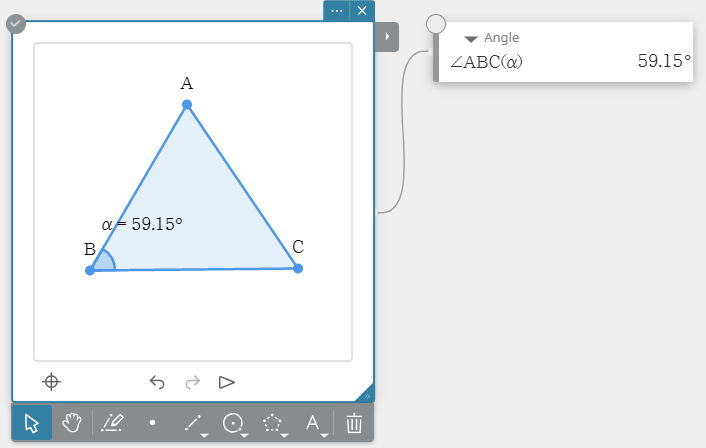
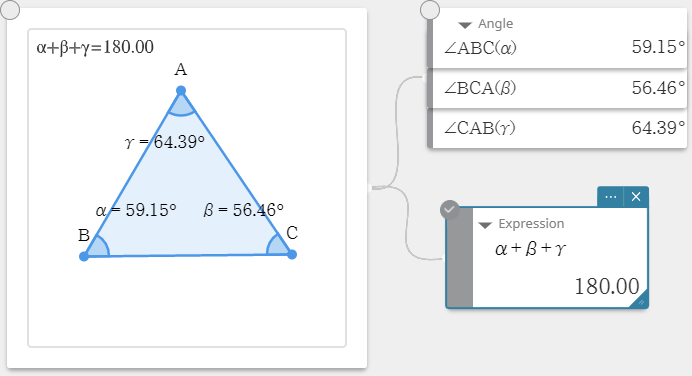
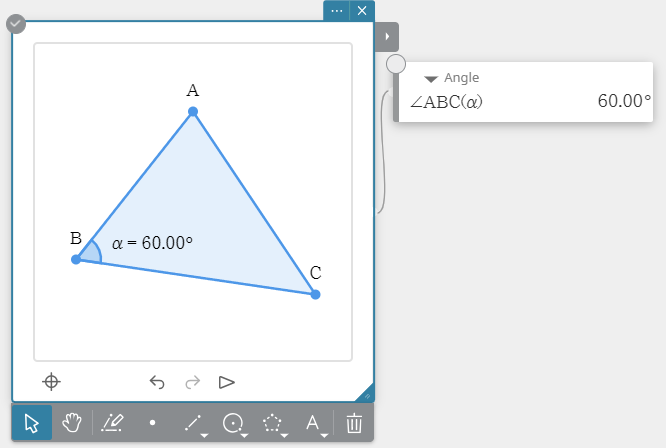
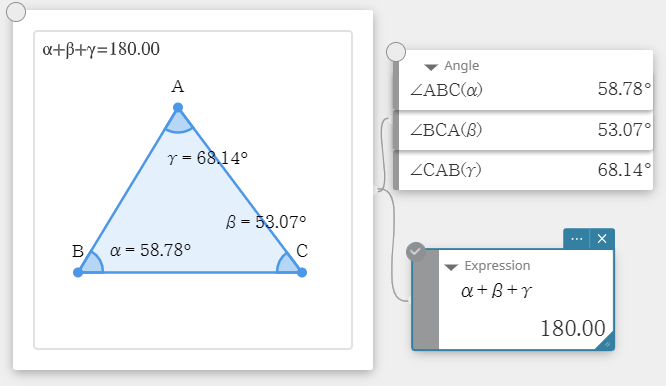
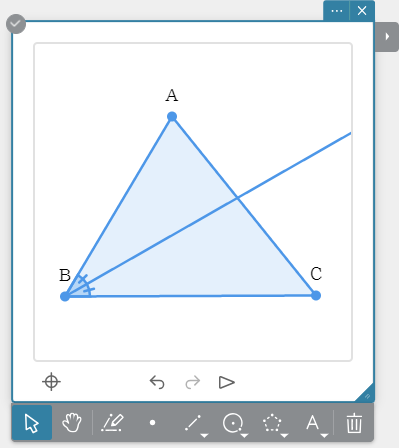
5-1-2. To display the sum of the interior angles of triangle ABC
1. Draw a triangle.
2. On the tool palette, click  .
.
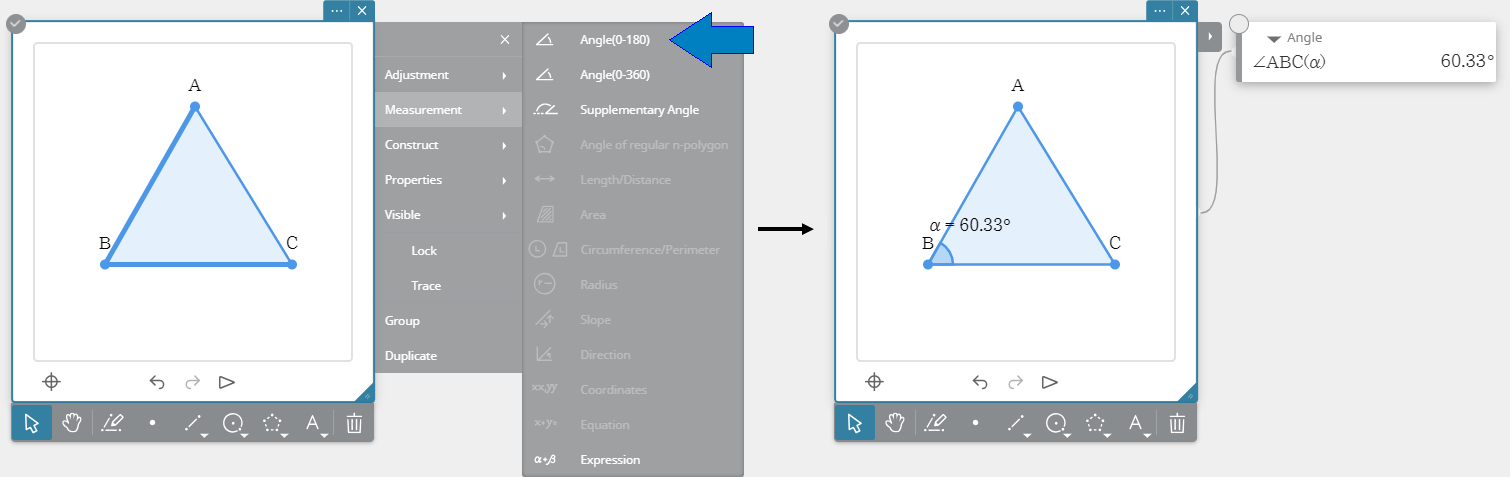
3. Click side AB and then side BC to select them.
4. Click  .
.
• This displays the Tool Menu.
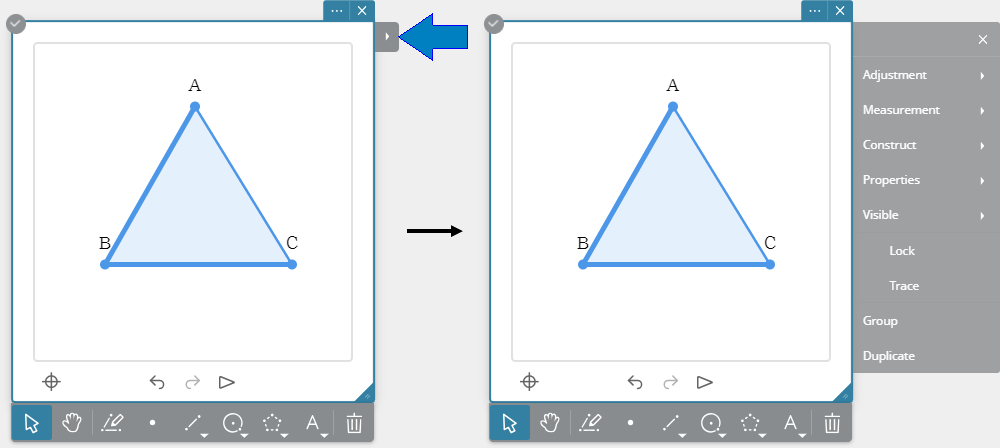
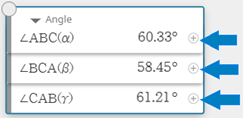
5. On the Tool Menu, click [Measurement] - [Angle (0-180)].
• This measures the interior angle formed by sides AB and BC, and displays the angle in an Angle Sticky Note.
6. Use the same operations as in steps 3 to 5 to measure the interior angle formed by sides BC and CA and the interior angle formed by sides CA and AB.
7. On the Tool Menu, click [Measurement] - [Expression].
• This creates an Expression Sticky Note.
8. On the Expression Sticky Note, input the expression ($\alpha + \beta + \gamma$) whose sum of interior angles you want to obtain.
• You can input values for $\alpha$,$\beta$, and $\gamma$ by clicking  on the Angle Sticky Note.
9. On the soft keyboard, click [Execute].
• This displays the calculation result on the Expression Sticky Note.
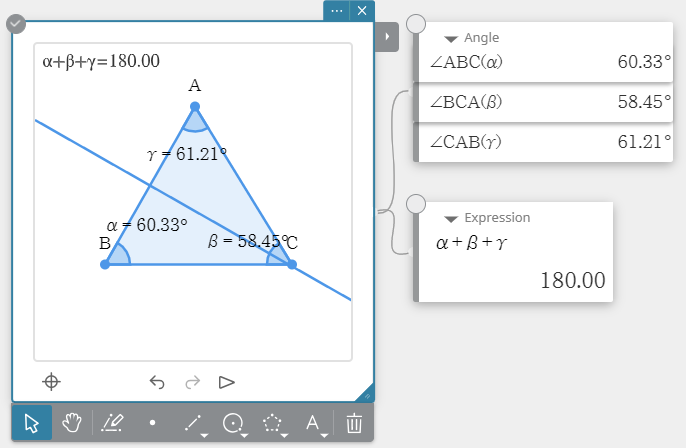
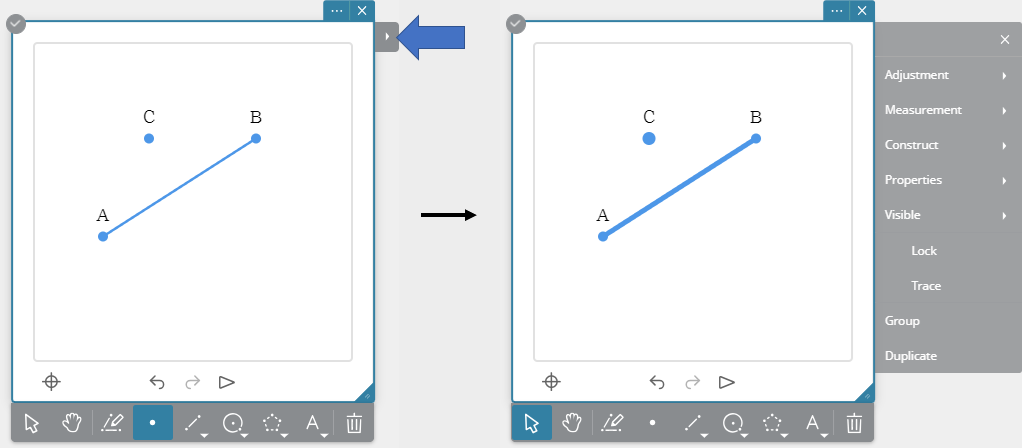
5-1-3. To construct a perpendicular bisector
1. Draw a triangle.
2. On the tool palette, click .
3. Click side AB to select it.
4. On the Tool Menu, click [Construct] - [Perp. Bisector].
• This constructs a perpendicular bisector of side AB.
Note
- Dragging a point or line segment will cause the corresponding measurement values to change accordingly. To drag a point or side, you need to select on the tool palette.
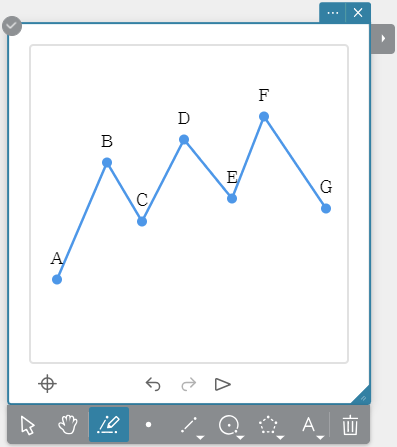
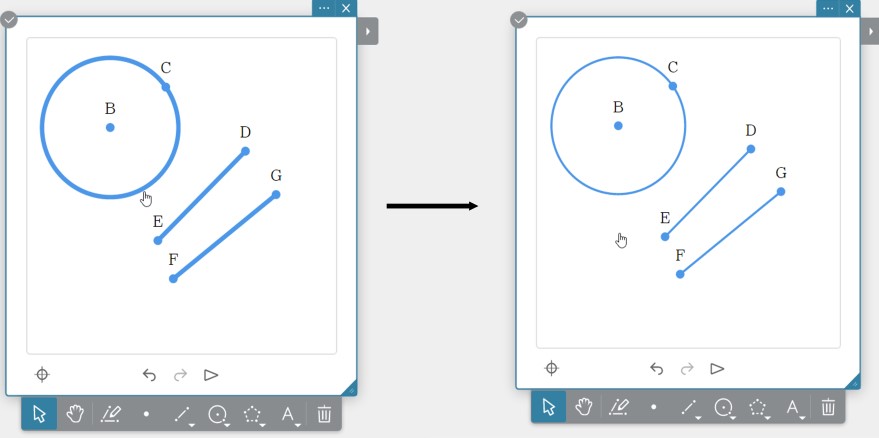
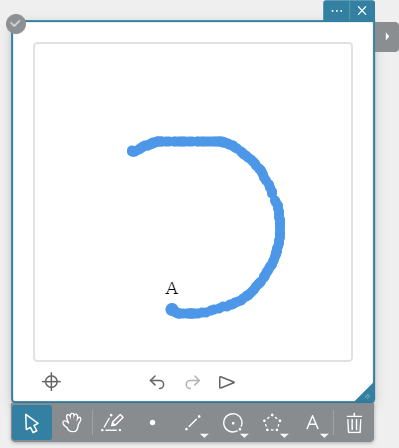
5-2. Drawing a Freehand Figure
After a freehand figure is drawn, it is interpreted and converted to a point, line segment, polyline, polygon, or circle.
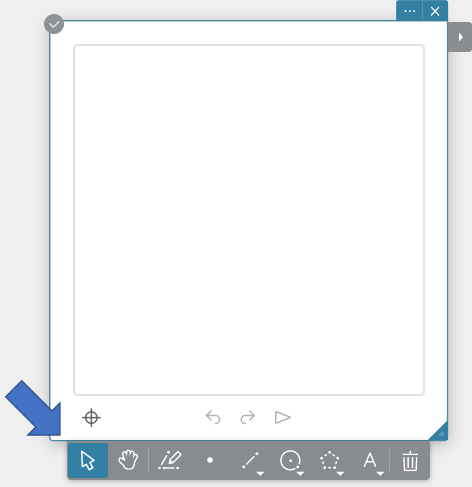
1. Create a Geometry Sticky Note.
2. On the tool palette, click  .
.
3. Use your mouse to draw the desired figure.
• To draw, move your mouse as you hold down its left button.
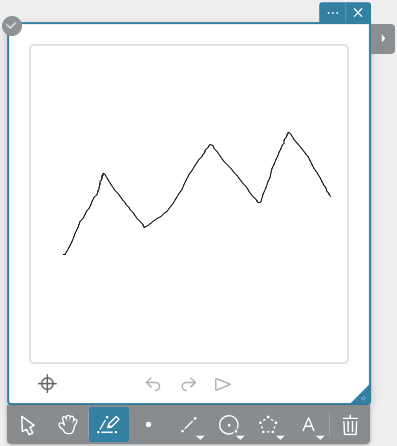
4. Release the left mouse button.
• The figure you drew will be interpreted.
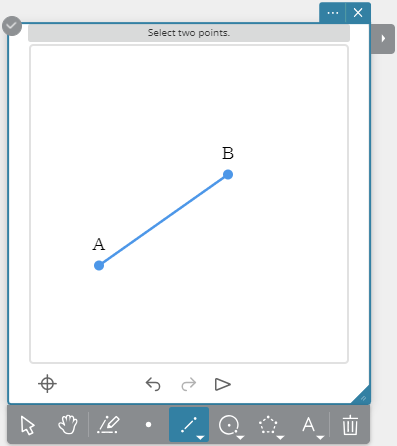
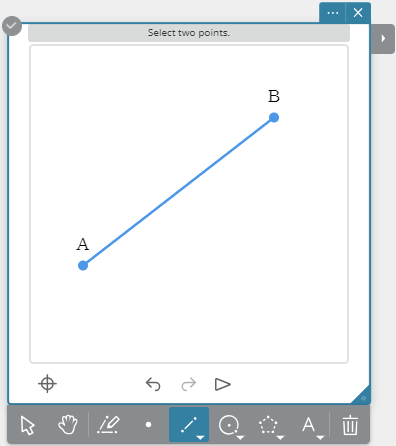
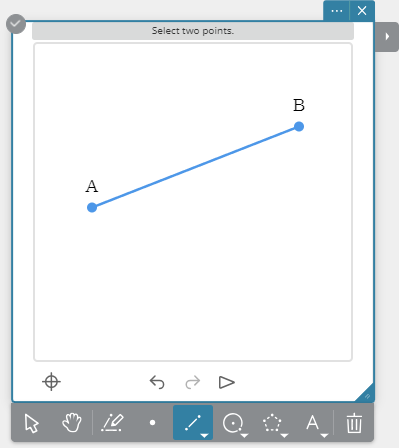
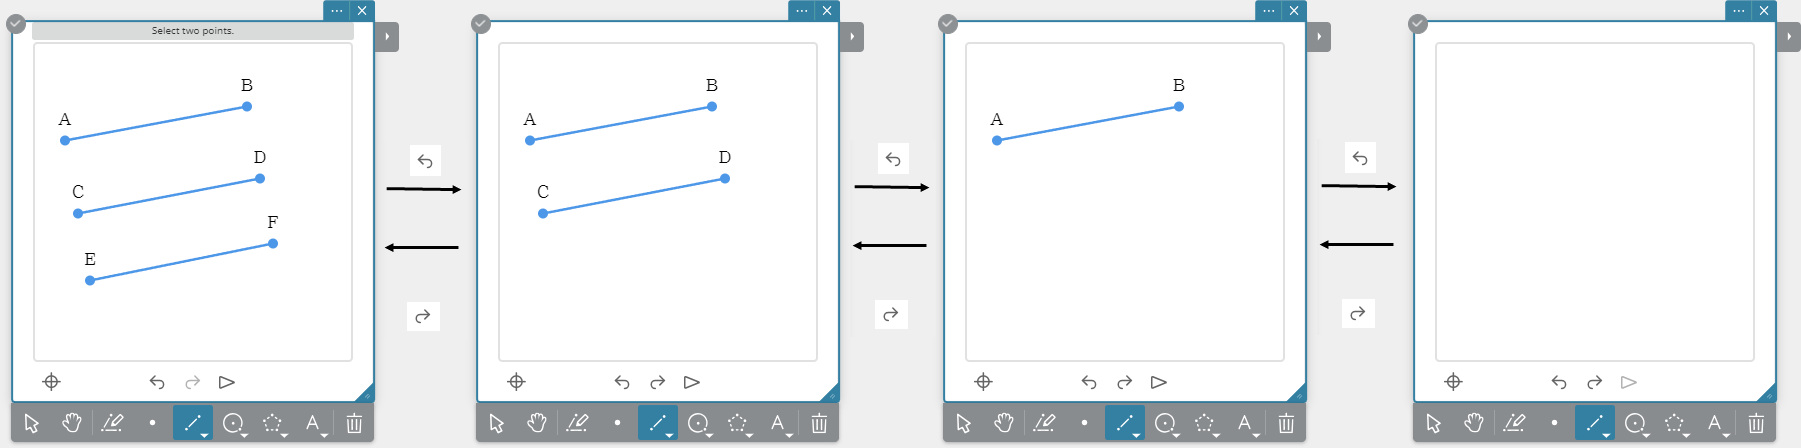
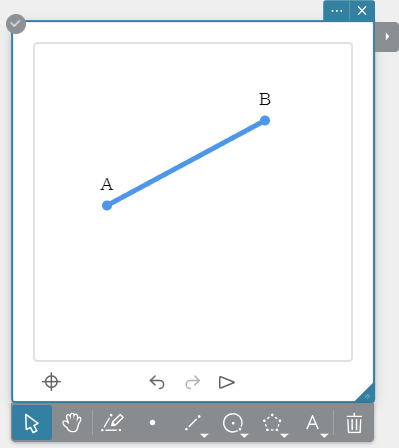
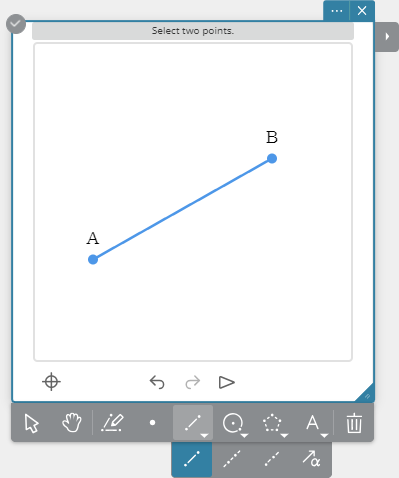
5-3. Drawing a Line Segment
1. Create a Geometry Sticky Note.
2. On the tool palette, click  .
.
• This displays the Line menu.
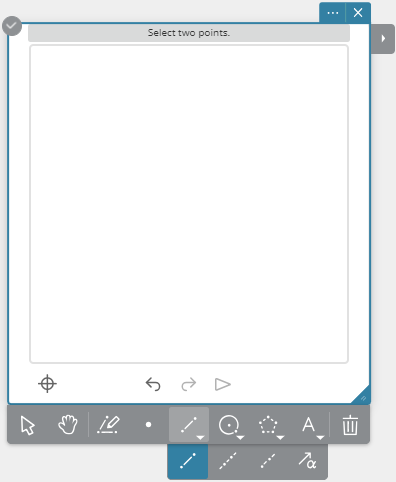
3. On the Line menu, click  .
.
4. Click the location you want to specify as the line segment start point.
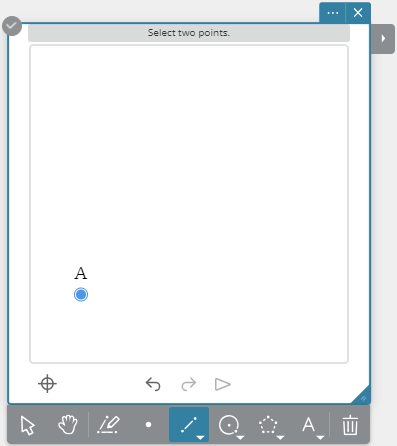
5. Click the location you want to specify as the line segment end point.
• This will draw a line segment between the two specified points.
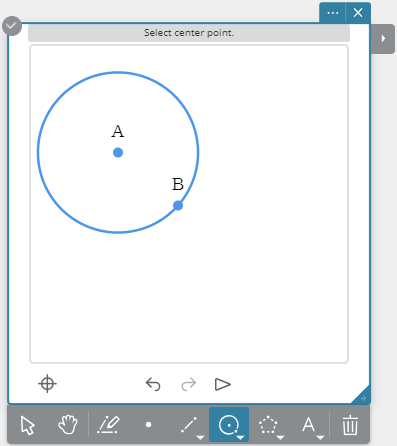
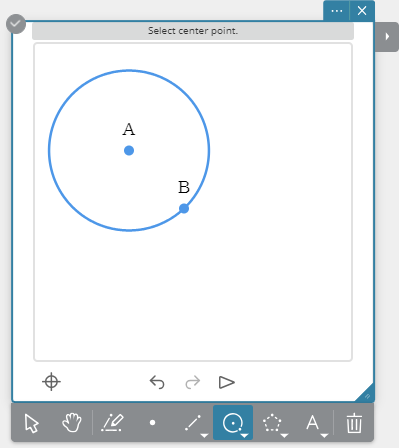
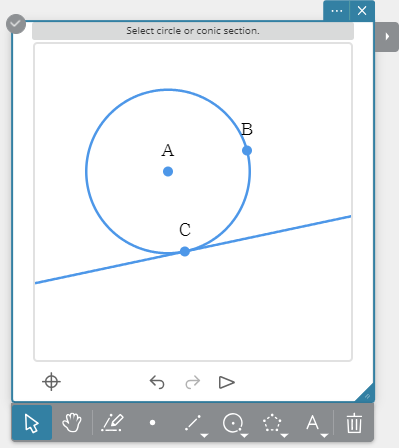
5-4. Drawing a Circle
1. Create a Geometry Sticky Note.
2. On the tool palette, click  .
.
• This displays the Circle menu.
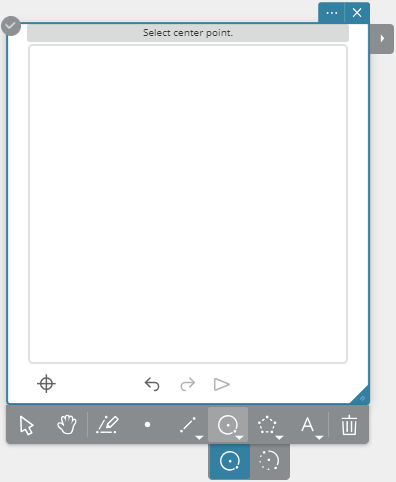
3. On the Circle menu, click  .
.
4. Click the locations you want to specify as the circle center point.
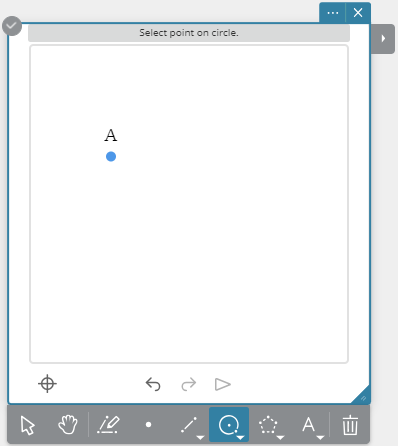
5. Click the location you want to specify as one point on the circle periphery.
• This draws the circle. The radius of the circle will be distance between the two points you specify.
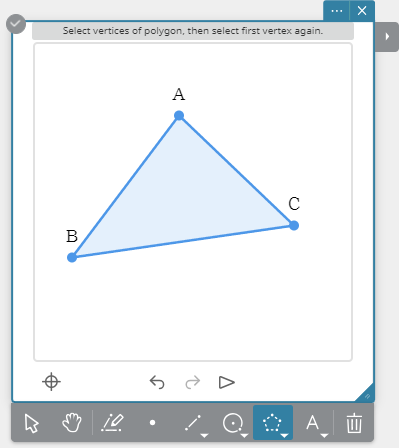
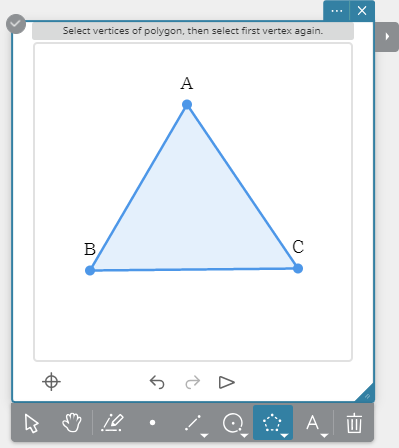
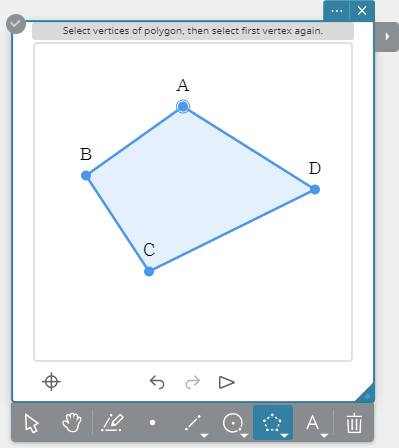
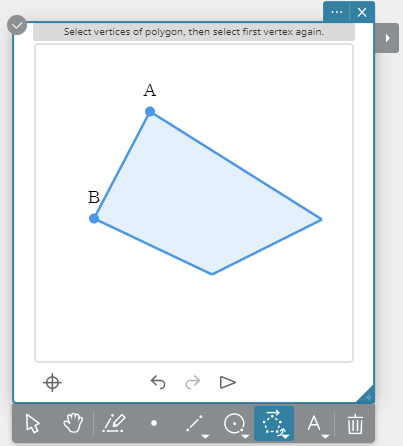
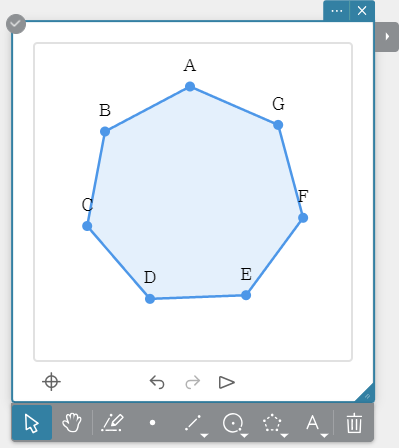
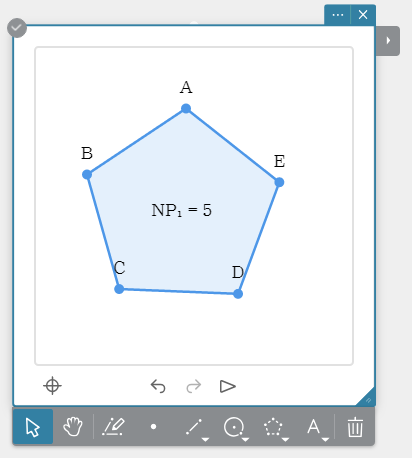
5-5. Drawing a Polygon
1. Create a Geometry Sticky Note.
2. On the tool palette, click  .
.
• This displays the Object menu.
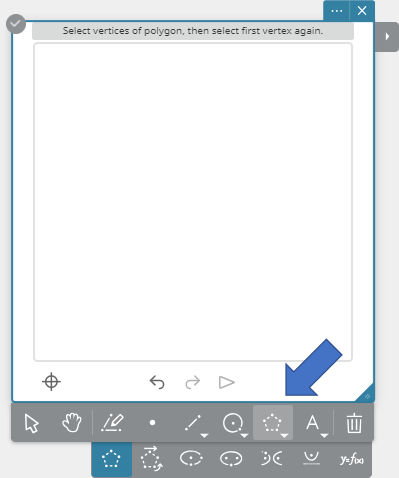
3. On the Object menu, click  .
.
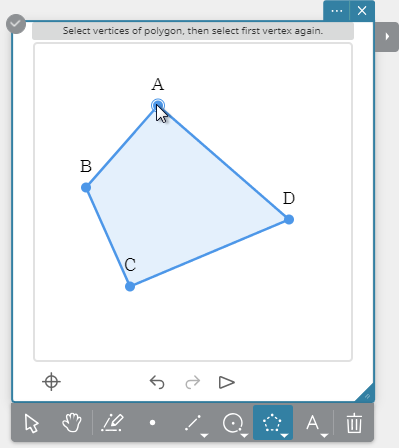
4. Click the location you want to specify as a vertex of the polygon.
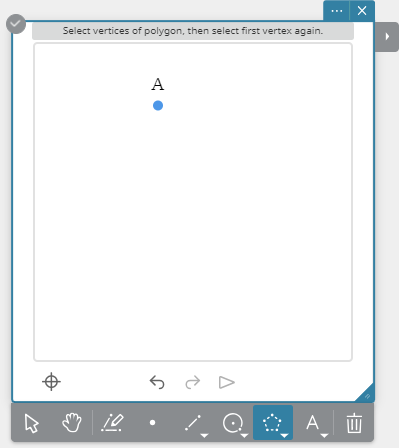
5. Click the locations you want to specify as the other vertices of the polygon.
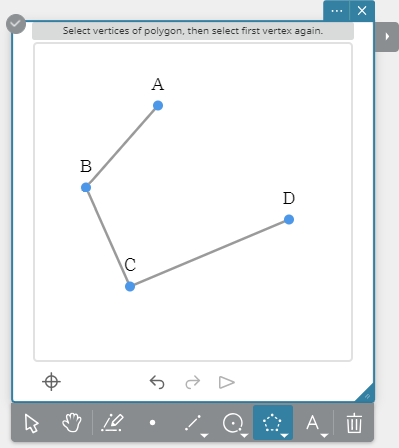
6. To complete the polygon, click the location of the first vertex.
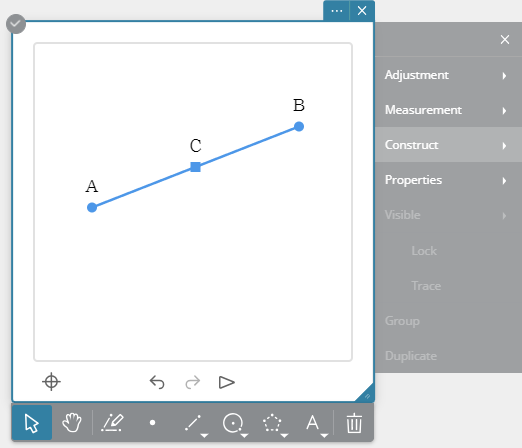
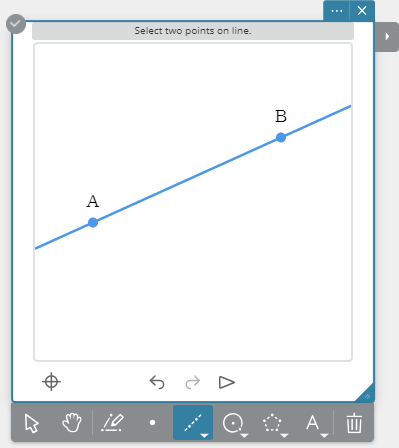
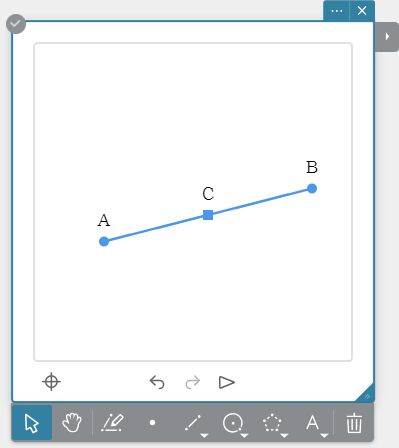
5-6. Adding Points on an Existing Line
You can use this procedure to add points on a line segment, on one side of a polygon, on a circle, etc.
Example: To add points on a line segment
1. Create a Geometry Sticky Note.
2. Draw a line segment.
3. On the tool palette, click  .
.
4. Click the line segment.
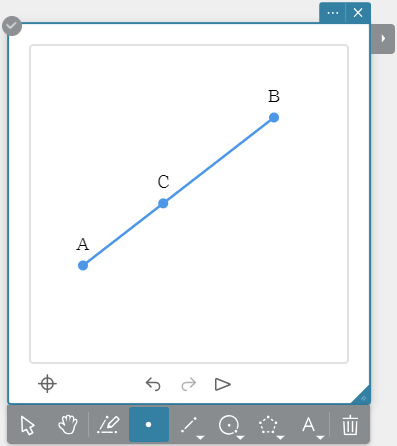
Note
- A point can be moved only along the line where it is located. A point cannot be moved off of its line.
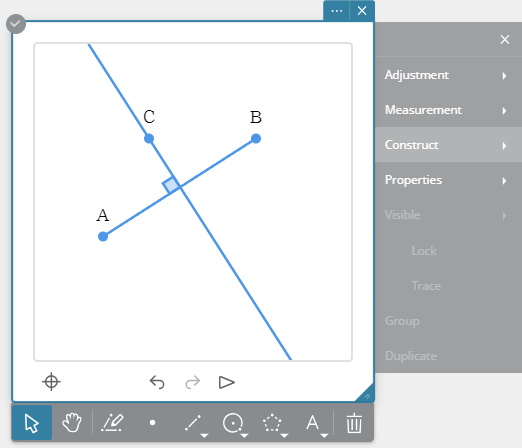
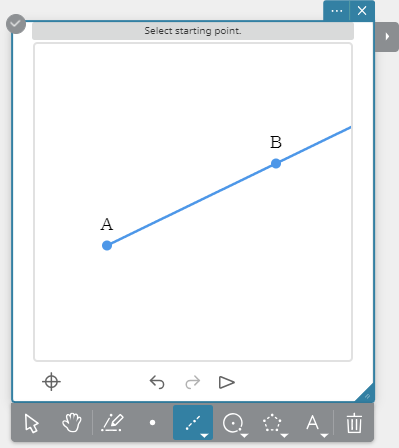
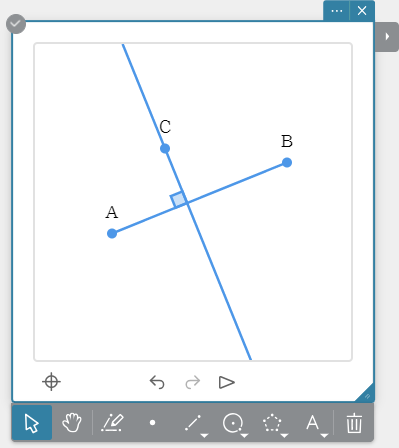
5-7. Constructing Perpendicular Lines
1. Create a Geometry Sticky Note.
2. Draw a line segment and plot a point.
3. On the tool palette, click  .
.
4. Select the line segment and point.
5. Click  .
.
• This displays the Tool Menu.
6. On the Tool Menu, click [Construct] - [Perpendicular].
• This will draw a perpendicular to the selected line segment that passes through the selected point.
Note
- This operation can be executed while one line segment and one point, or one side of a polygon and one point are selected.
5-8. Constructing a Center Point
1. Create a Geometry Sticky Note.
2. Draw a line segment.

3. On the tool palette, click  .
.
4. Select the line segment.
5. Click  .
.
• This displays the Tool Menu.
6. On the Tool Menu, click [Construct] - [Midpoint].
• This will construct the midpoint of the line segment you selected in step 4.
Note
- This operation can be executed while one line segment, one side of a polygon, or two points are selected.
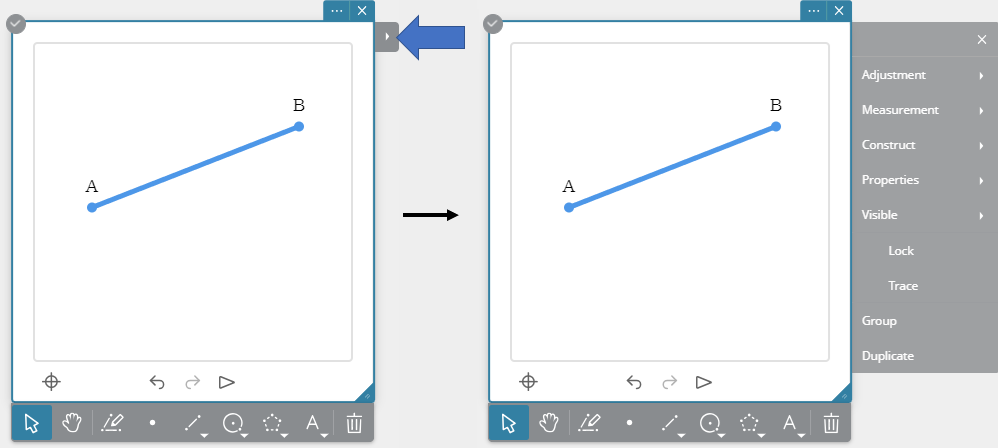
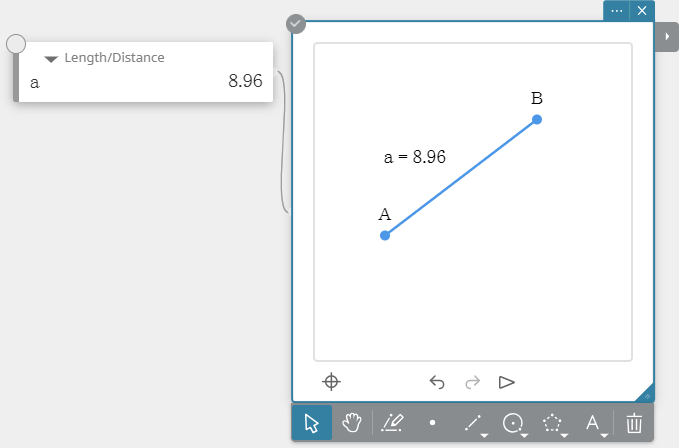
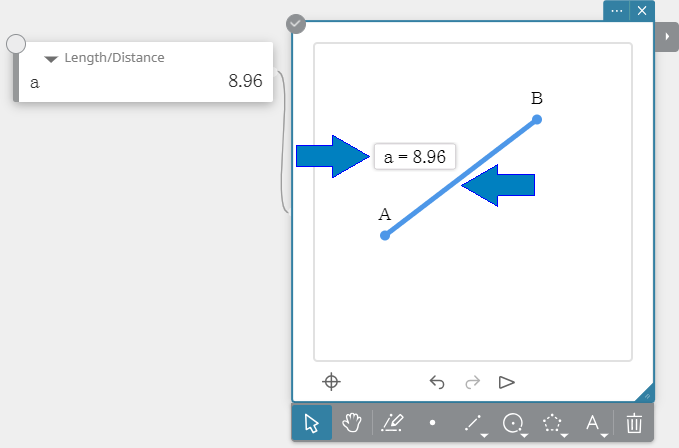
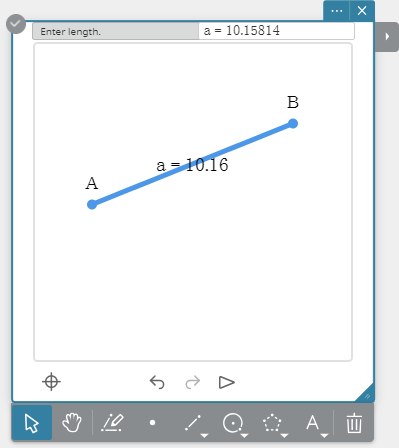
5-9. Measuring the Length of a Line Segment
1. Create a Geometry Sticky Note.
2. Draw a line segment.
3. On the tool palette, click  .
.
4. Select the line segment.
5. Click  .
.
• This displays the Tool Menu.
6. On the Tool Menu, click [Measurement] - [Length/Distance].
• This displays the length of the selected line segment.
Note
- This operation can be executed while two points, a line segment, a vector, or one side of a polygon is selected.
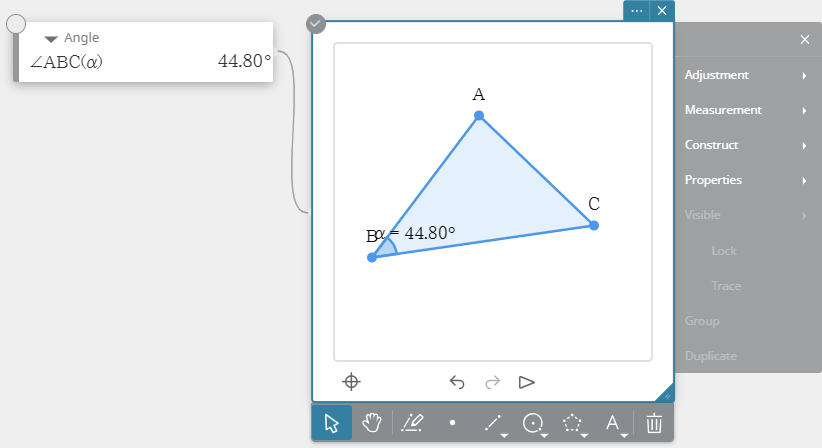
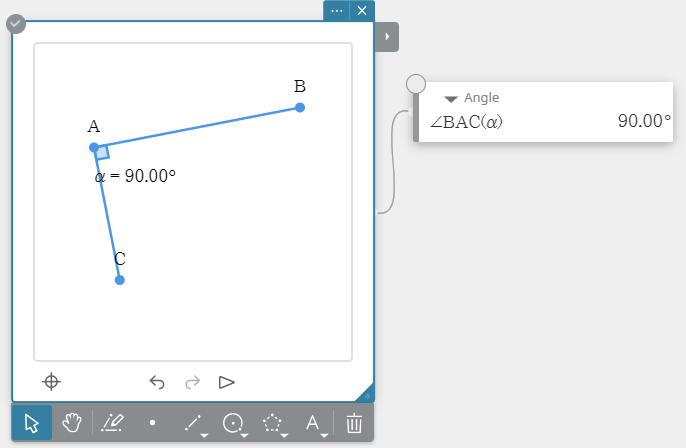
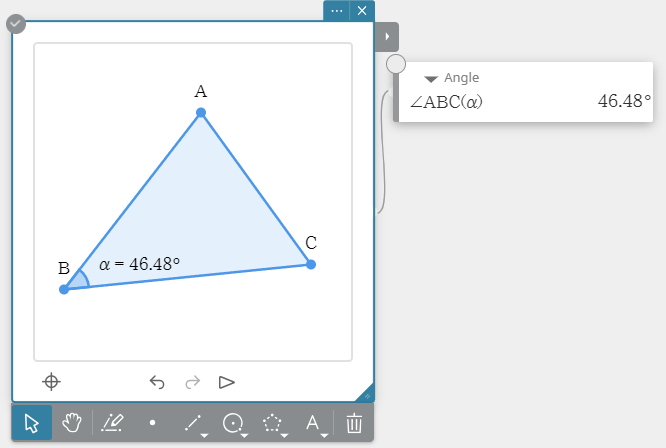
5-10. Measuring an Angle
Example: To measure an interior angle of a triangle
1. Create a Geometry Sticky Note.
2. Draw a triangle.
3. On the tool palette, click  .
.
4. Click side AB and then side BC to select them.
5. Click  .
.
• This displays the Tool Menu.
6. On the Tool Menu, click [Measurement] - [Angle (0-180)].
• This measures the angle between the selected two sides (AB and BC), and displays it on the Angle Sticky Note.
Note
- This operation can be executed while any two of the following items (two of the same type, or one each of different types) are selected: line segment, straight line, ray, vector, or one side of a polygon.
5-11. Using Measurement Values in a Calculation
Example: To calculate the total of the interior angles of a triangle
1. Create a Geometry Sticky Note.
2. Draw a triangle.
3. On the tool palette, click  .
.
4. Click side AB and then side BC to select them.
5. Click .
• This displays the Tool Menu.
6. On the Tool Menu, click [Measurement] - [Angle (0-180)].
• This measures the angle between the selected two sides (AB and BC), and displays it on the Angle Sticky Note.
7. Use the same operations as in steps 4 to 6 to measure the interior angle formed by sides BC and CA and the interior angle formed by sides CA and AB.
8. On the Tool Menu, click [Measurement] - [Expression].
• This creates an Expression Sticky Note.
9. On the Expression Sticky Note, input the expression ($\alpha + \beta + \gamma$) whose sum of interior angles you want to obtain.
• You can input values for $\alpha$,$\beta$ and $\gamma$ by clicking  on the Angle Sticky Note.

10. On the soft keyboard, click [Execute].
• This displays the calculation results on the Expression Sticky Note.
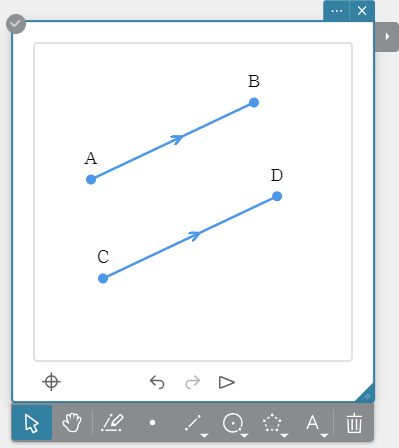
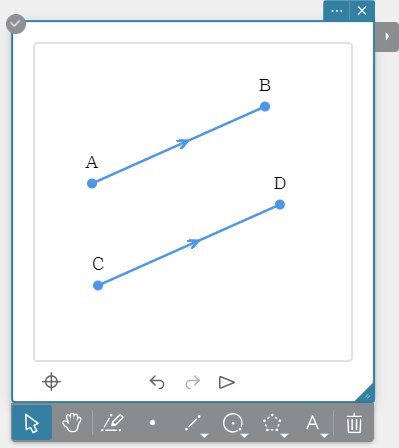
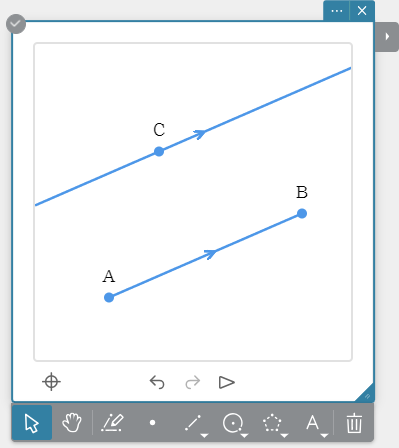
5-12. Making Two Lines Parallel
1. Create a Geometry Sticky Note.
2. Draw two line segments.
3. On the tool palette, click  .
.
4. Select the two line segments.
5. Click  .
.
• This displays the Tool Menu.
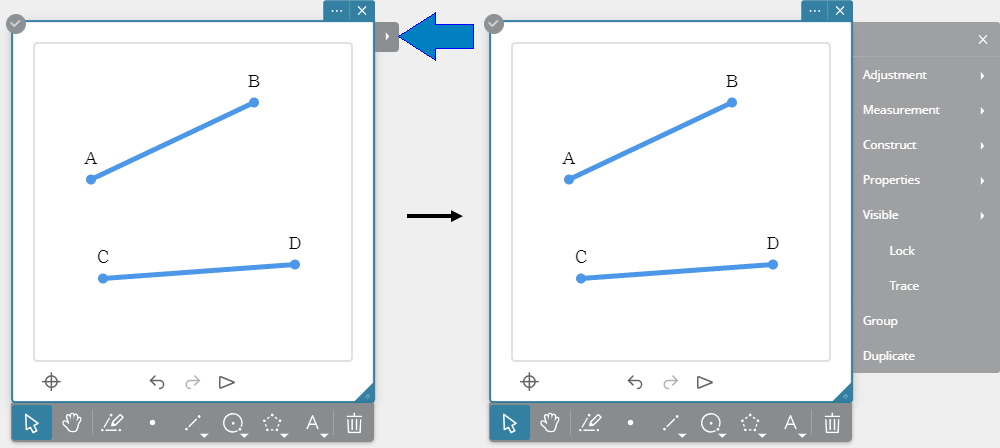
6. On the Tool Menu, click [Adjustment] - [Parallel].
• This makes the two line segments parallel to each other.
Note
- The orientation of the second line you select is changed to match the orientation of the first line you select.
- An arrow symbol (>) will appear on both lines when they are parallel with each other.
- Any two of the following items (two of the same type, or one each of different types) can be selected and made parallel with each other: line segment, straight line, ray, vector, or one side of a polygon.
5-13. Making Two Lines Perpendicular
1. Create a Geometry Sticky Note.
2. Draw two line segments.
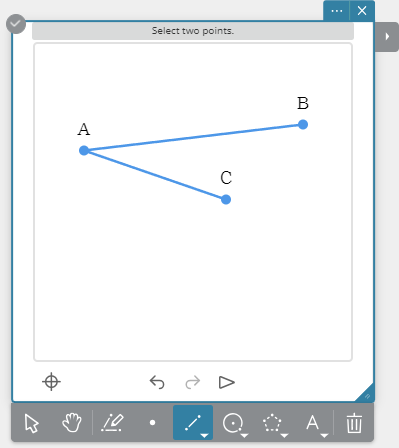
3. On the tool palette, click  .
.
4. Select the two line segments.
5. Click  .
.
• This displays the Tool Menu.
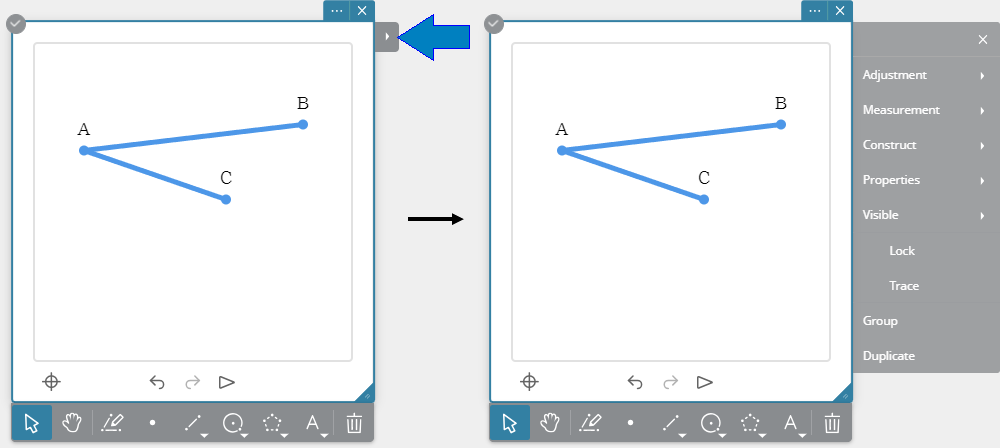
6. On the Tool Menu, click [Adjustment] - [Perpendicular].
• This makes the two line segments perpendicular with each other.
Note
- The orientation of the second line you select is changed to make it perpendicular with the first line you select.
- Any two of the following items (two of the same type, or one each of different types) can be selected and made perpendicular with each other: line segment, straight line, ray, vector, or one side of a polygon.
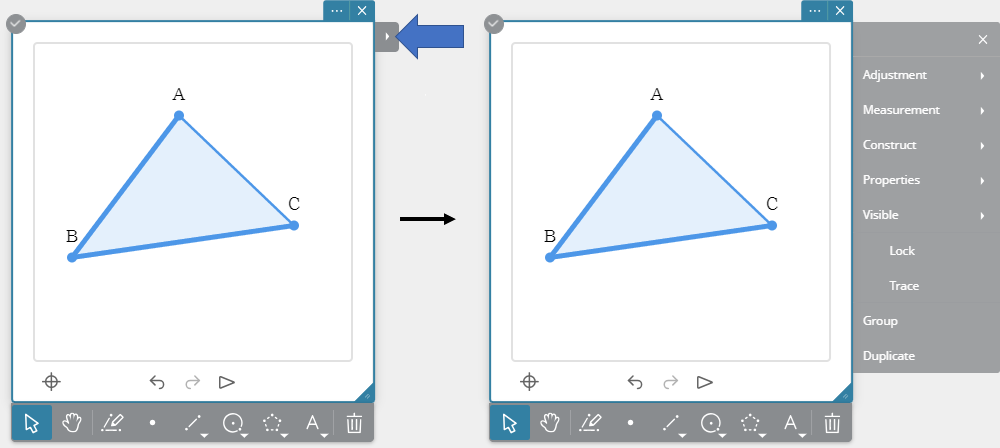
5-14. Selecting a Figure
5-14-1. To select a figure
1. Click an existing Geometry Sticky Note to select it.
2. On the tool palette, click  .
.
3. Click the figure you want to select.
• This thickens the line of the selected figure.
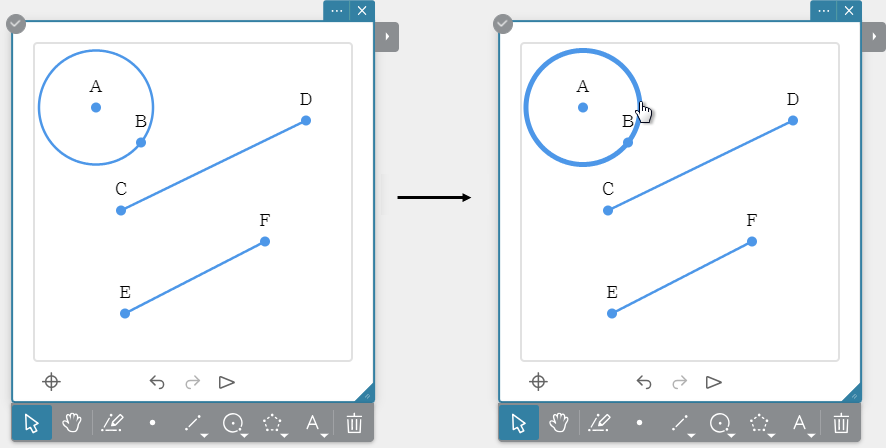
• You can click another figure at this point to select multiple figures.
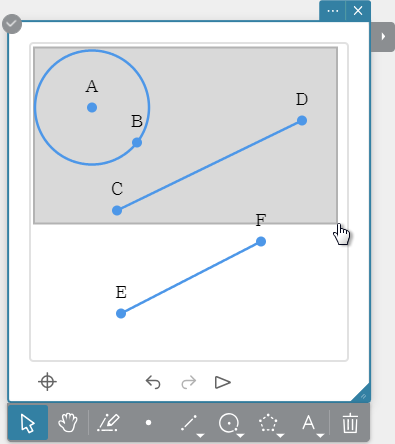
Note
- You can also select multiple figures by creating a selection box around them.
5-14-2. To deselect a figure
- To deselect the currently selected figure, click it. This causes the lines of the figure to change from thick (selected) to thin (deselected).
- To deselect all currently selected figures, click a blank space in the drawing area.
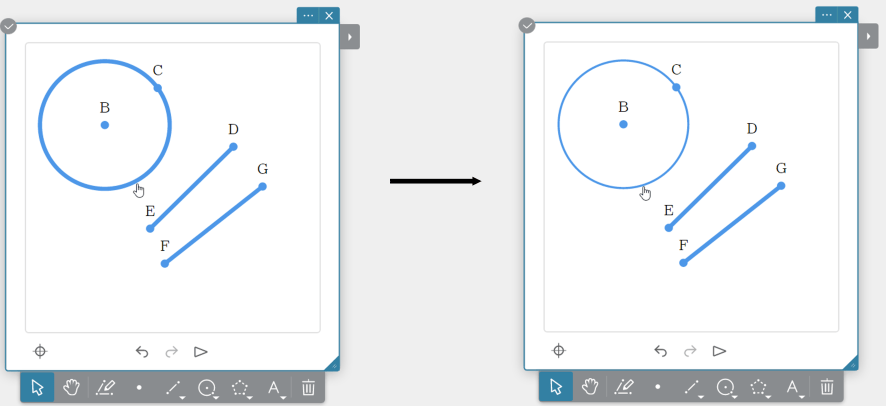
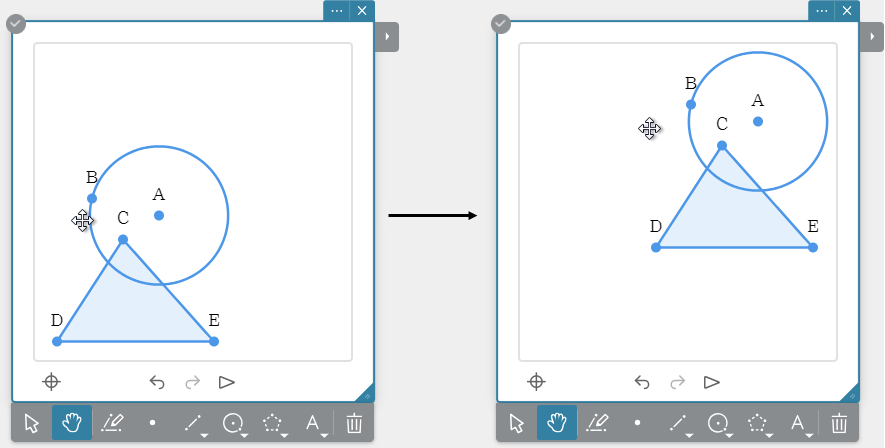
5-15. Moving a Figure
1. Click an existing Geometry Sticky Note to select it.
2. On the tool palette, click  .
.
3. Use your mouse to drag the figure you want to move.
Note
- You can select multiple figures and move them all at the same time, if you like.
5-16. Deleting a Figure
1. Click an existing Geometry Sticky Note to select it.
2. On the tool palette, click  .
.
3. Click a figure to delete it.
• You can continue clicking other figures to delete them.
Note
- Selecting multiple figures and then clicking
 will delete all of them.
5-17. Draw History
A history of Geometry Sticky Note draw operations is maintained automatically.
Each click of  at the bottom of the Geometry Sticky Note will move back chronologically through draw history entries.
Each click of  will move forward chronologically through draw history entries.
Example: After you've drawn three line segments
5-17-1. To auto play draw history entries
Clicking  at the bottom of a Geometry Sticky Note will start sequential auto play of draw history from the first entry.
To pause auto play, click  . While auto play is paused, you can click
  or
or  to scroll entry-by-entry.
To exit auto play, click  .
.
5-18. Zooming the Draw Area
1. Click an existing Geometry Sticky Note to select it.
2. Move the mouse pointer the location you want to zoom.
3. Rotate the scroll wheel of your mouse to zoom the draw area.
Note
- If you are using a smartphone or tablet, you can zoom by pinching in or pinching out.
- To return to the default draw area, click
 in the lower left corner of the Geometry Sticky Note.
5-19. Panning the Draw Area
1. Click an existing Geometry Sticky Note to select it.
2. On the tool palette, click  .
.
3. Drag the draw area to pan it.
Note
- To return to the default draw area, click
 in the lower left corner of the Geometry Sticky Note.
5-20. Configuring Draw Area Settings
1. Click an existing Geometry Sticky Note to select it.
2. Click the Menu button ( ).
).
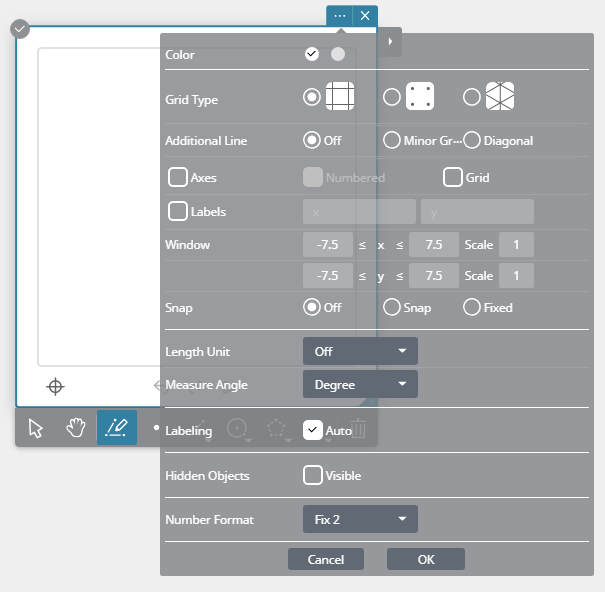
3. Configure the settings below.
| Grid Type: | Specifies one of the following grid types: Square Grid (  ) )Square Dot (  ) )Isometric Grid (  ) ) |
||||||||
| Additional Line: | When "Square Grid" is selected for "Grid Type", specifies the additional line setting. | ||||||||
|
|||||||||
| Axes: | Select this check box to show the coordinate axes in the draw area. | ||||||||
| Numbered: | Select this check box to show the coordinate axes and tick marks in the draw area. | ||||||||
| Grid: | Select this check box to show a grid in the draw area. | ||||||||
| Labels: | Select this check box to show coordinate axis names in the draw area. You can change an axis name, if you want. |
||||||||
| Window: | |||||||||
|
|||||||||
| Snap: | Specifies the snap-to-grid setting. | ||||||||
|
|||||||||
| Length unit: | Specifies the length unit. Specifying [Off] hides the unit. | ||||||||
| Measure Angle: | Specifies the angle unit. | ||||||||
| Labeling: | Selecting the [Auto] check box automatically adds labels to plotted points. | ||||||||
| Hidden Objects: | Selecting the [Visible] check box causes hidden figures to be displayed in grey. Clicking [Show All] re-displays hidden figures. | ||||||||
5-21. Displaying an Image in a Geometry Sticky Note
1. Create a Geometry Sticky Note.
2. On the tool palette, click  .
.
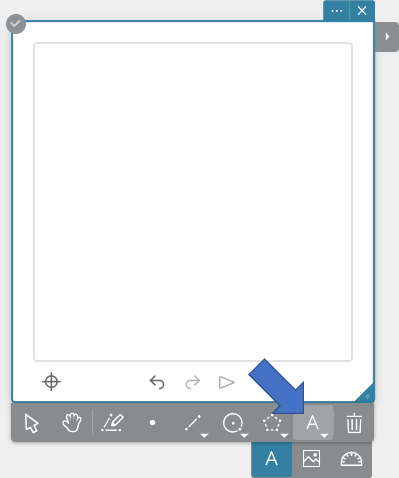
3. Click  .
.
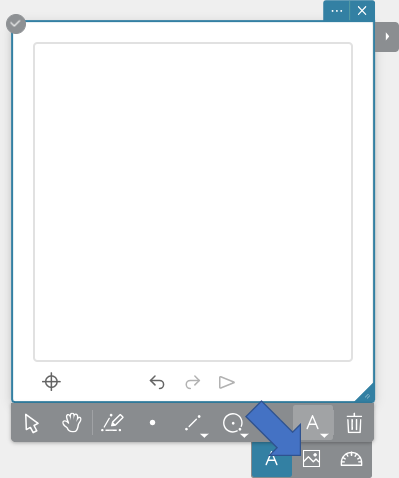
• This displays an Image Sticky Note.
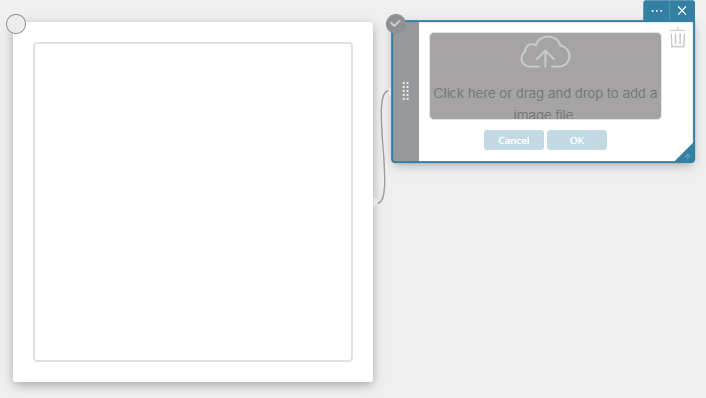
4. Click  .
.
• This displays a dialog box for opening a file.
5. Select the image file you want and then click [Open].
6. On the Image Sticky Note, click [OK].
• This displays the image selected with the Geometry Sticky Note.
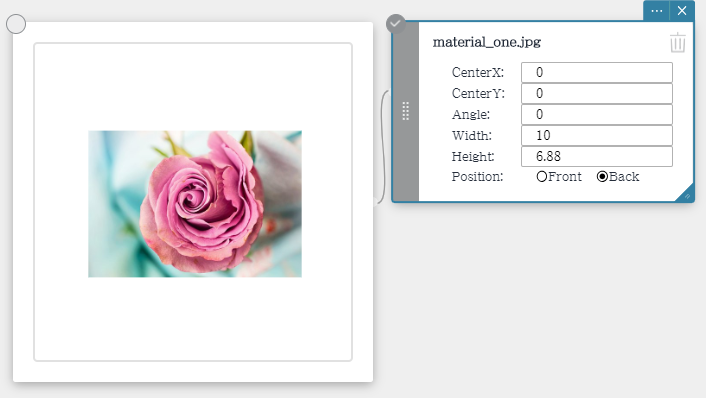
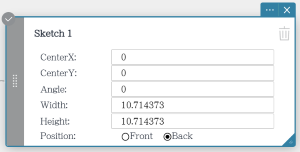
・You can configure the settings below for an Image Sticky Note.
-
Center X: Specifies the x-axis value of the image center. Center Y: Specifies the y-axis value of the image center. Angle: Specifies the image rotation angle. Width: Specifies the image width. Height: Specifies the image height. - Position:
-
- Front ... Displays the image in front of the coordinate axes and the grid.
- Back ... Displays the image in back of the coordinate axes and the grid.
Note
- Instead of performing steps 3 through 5, you can also drop the desired image file onto the Image Sticky Note.
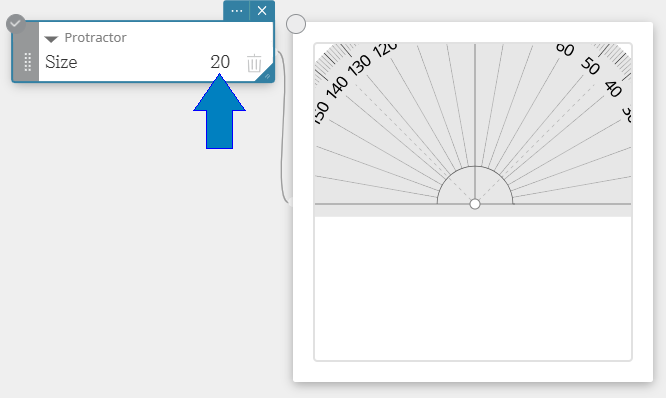
5-22. Using the Protractor
1. Create a Geometry Sticky Note.
2. On the tool palette, click  .
.
3. Click  .
.
• This displays the protractor.
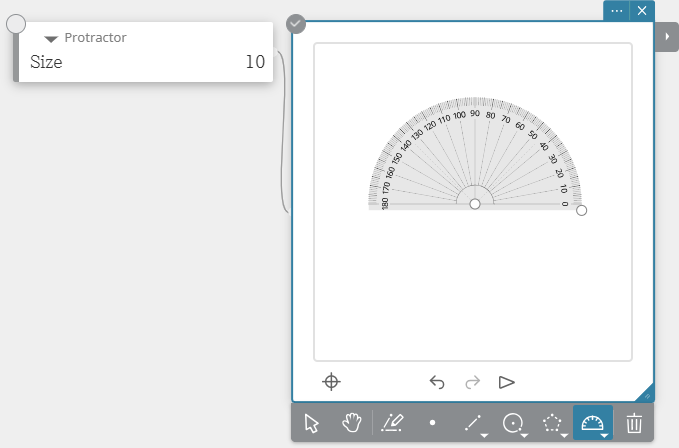
Note
- You can drag once of the circles (
 ) on the protractor to move it or to rotate it.
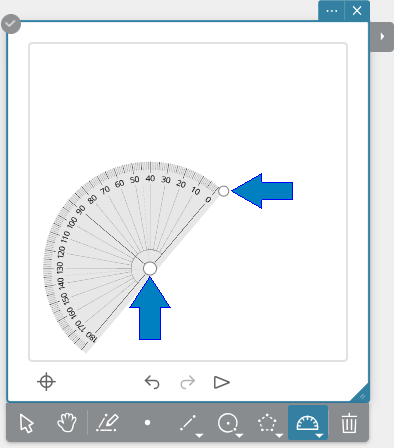
- Changing the value in the Protractor Sticky Note will change the size of the protractor.
5-23. Locking a Point
A locked plotted point cannot be repositioned.
1. Create a Geometry Sticky Note.
2. Draw a line segment.
3. Select the start point or end point of the line segment.
4. Click  to display the Tool Menu.
5. On the Tool Menu, click "Lock".
・This locks the point you selected in step 2.
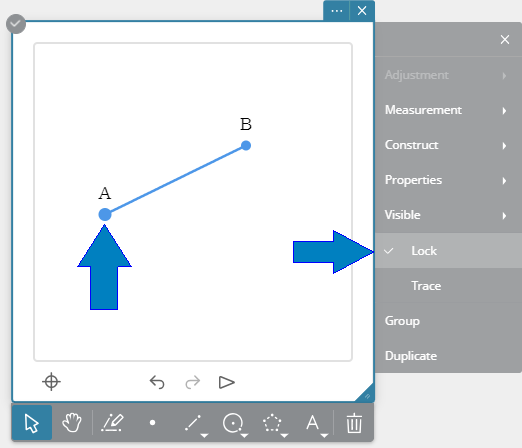
・You can drag unlocked points only.
・To unlock a point, click "Lock" on the Tool Menu again.
5-24. Using Trace
When Trace is enabled, a line is drawn along the path that you drag a selected point or line segment.
1. Create a Geometry Sticky Note.
2. Plot a point.
3. Select the point.
4. Click  to display the Tool Menu.
5. On the Tool Menu, click "Trace".
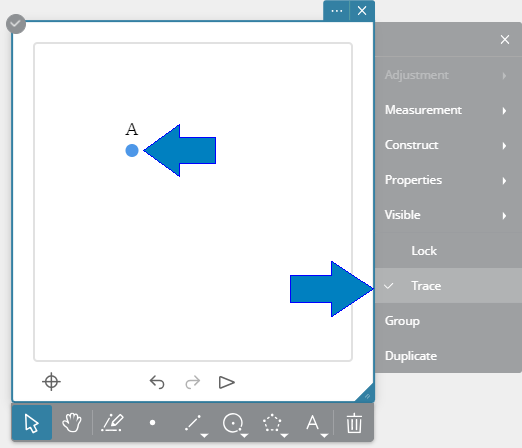
6. Drag the point to draw the path of movement.
• To disable trace, click "Trace" on the Tool Menu again.
5-25. Configuring Figure Property Settings
1. Click an existing Geometry Sticky Note to select it.
2. On the tool palette, click .
3. Click the figure whose Property settings you want to change.
4. Click  .
.
• This displays the Tool Menu.
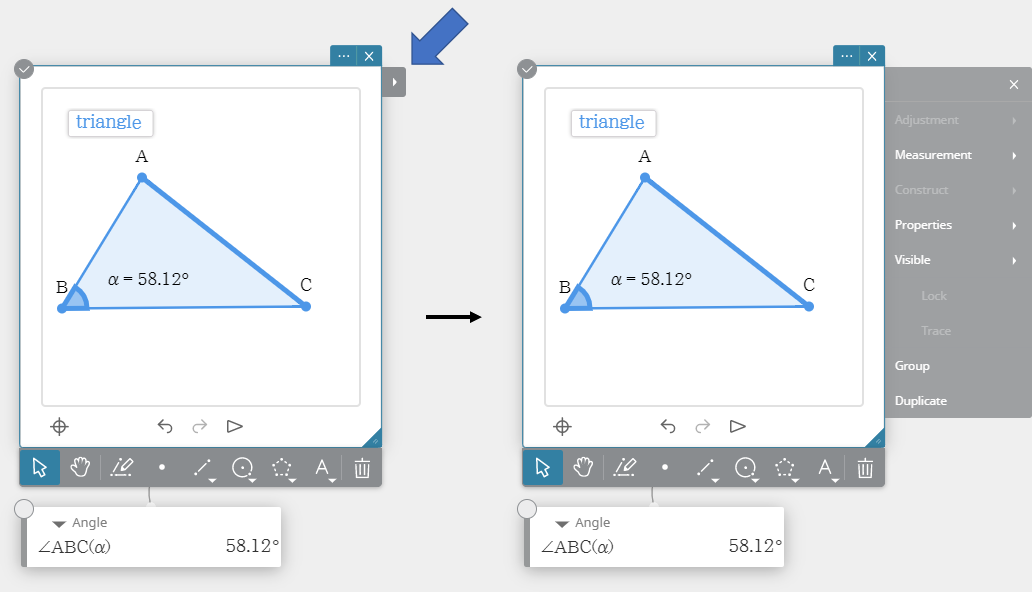
5. On the Tool Menu, click [Properties].
• This displays the Property Menu.
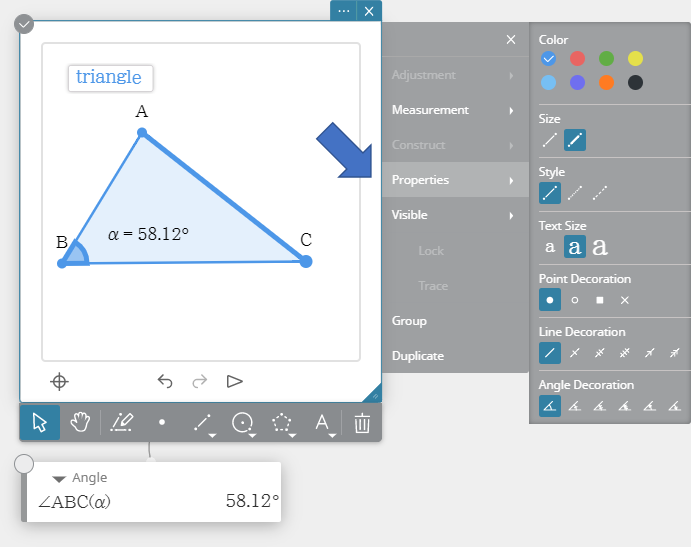
6. You can use this screen to configure settings below.
-
Color: Specifies the figure color. Size: Specifies the line thickness. Style: Specifies the line style. Test size: Specifies the text size. Point Decoration: Specifies how points are marked. Line Decoration: Specifies how lines are marked. Angle Decoration: Specifies how angles are marked.
5-26. Hiding a Figure
The example below shows how to hide a line segment.
1. Create a Geometry Sticky Note.
2. Draw a line segment and then measure its length.
3. Select the line segment and measurement result (line segment length).
4. On the Tool Menu, click [Visible].
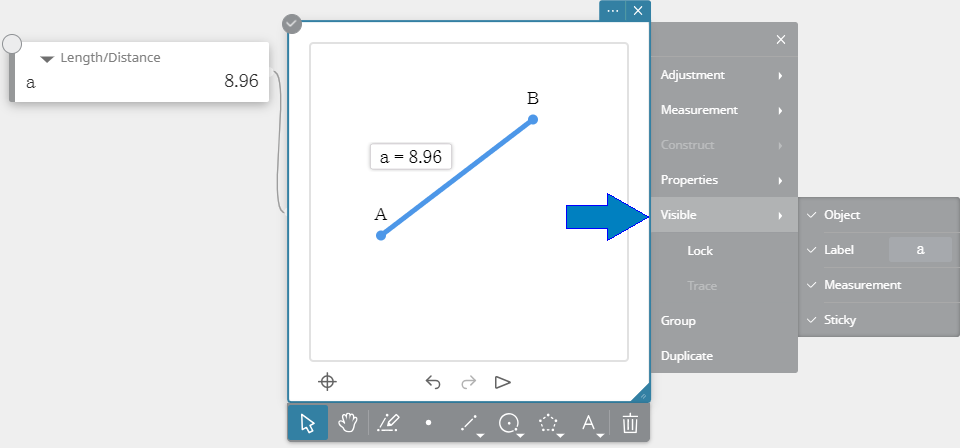
5. Clicking the items below toggles them between show and hide.
-
Object: Toggles figure display between show and hide. Label: Toggles label display between show and hide.
You can rename a label, if you want. *Measurement: Toggles measurement display between show and hide. Sticky: Toggles Sticky Note display between show and hide. -
- * You can make changes using the Tool Menu's [Visible] – [Label] option only while a label name like the ones below is selected.
-
- - Point label names (A, B, C, etc.)
- - Measured length or distance value (5-9. Measuring the Length of a Line Segment) label names ("a" of a = 10, etc.)
- Note that though you cannot directly change the label name (A(5, 10), etc.) of the coordinates of a point ("Coordinates" under "5-31. Measurement Functions"), changing a point label name also changes the label name of the applicable coordinates.
Note
- You can also hide a figure by right-clicking it. On the menu that appears, select
 . However, even if this operation hides measurement values in the drawing area, the Sticky Note remains displayed. If you want to hide a Sticky Note, use the "Sticky" item on the menu that appears in step 5 above.

5-27. Grouping Figures
1. Create a Geometry Sticky Note.
2. Draw multiple figures and then select them.
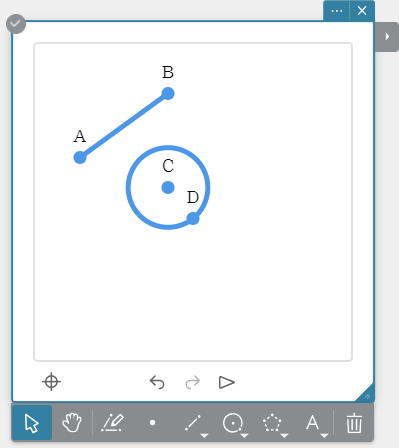
3. On the Tool Menu, click [Group].
• This groups the selected figures and displays a Visible Sticky Note.
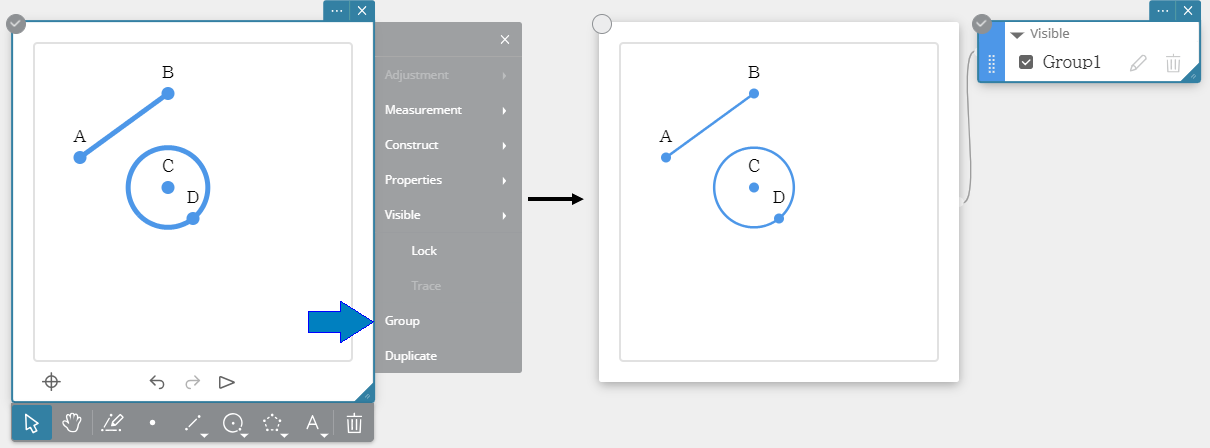
• To ungroup figures, click  on the Visible Sticky Note.
Note
- The functions described below are available with a Visible Sticky Note.
- The Visible Sticky note color can be changed by clicking the Drag Handle ( ).
).
- The group name can be changed by clicking  .
.
- All grouped figures can be hidden by clicking  .
.
- Hidden grouped figures can be shown again by clicking  .
.
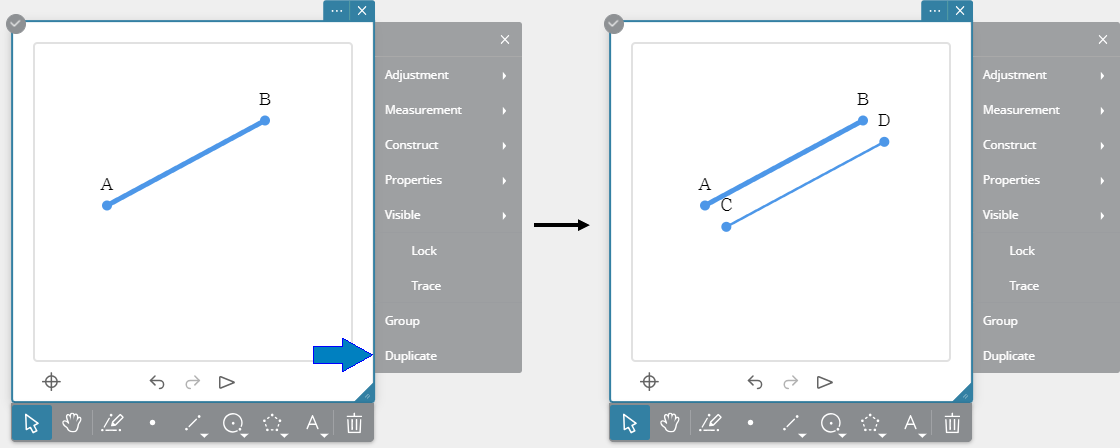
5-28. Duplicating a Figure
1. Create a Geometry Sticky Note.
2. Draw a figure and then select it.
3. On the Tool Menu, click [Duplicate].
• This duplicates the selected figure.
5-29. Drawable Figures
 Drawing Drawing |
|
|---|---|
| This tool can be used for freehand point plotting, or drawing of a line segment, polyline, polygon, or circle. | 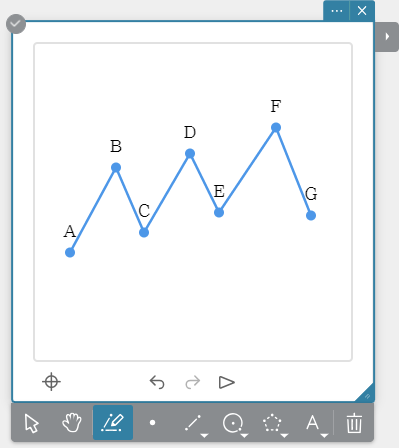 |
 Point Point |
|
| Click the location where you want to plot a point. | 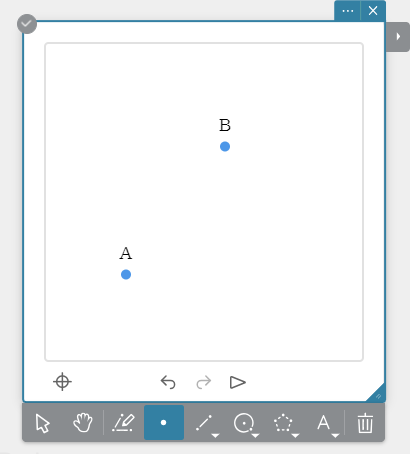 |
 Segment Segment |
|
|
1. Click the location you want to specify as the line segment start point. 2. Click the location you want to specify as the line segment end point. ・This will draw a line segment between the two specified points. |
 |
 Line Line |
|
|
1. Click any location. 2. Click another location. ・This will draw a straight line that passes between the two points. |
 |
 Ray Ray |
|
|
1. Click any location. 2. Click another location. ・This will draw a ray that starts from the first point you specified and passes through the second point. |
 |
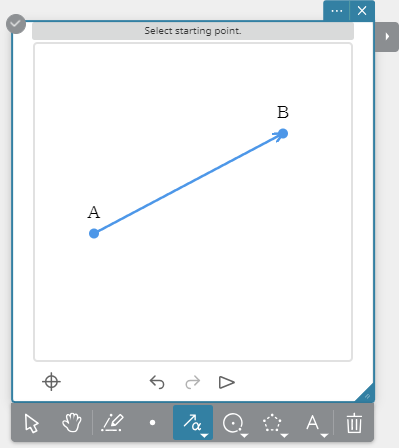
 Vector Vector |
|
|
1. Click the location you want to specify as the vector start point. 2. Click the location you want to specify as the vector end point. |
 |
 Circle Circle |
|
|
1. Click the location you want to specify as the circle center point. 2. Click the location you want to specify as one point on the circle periphery. ・The radius of the circle will be distance between the two points you specify. |
 |
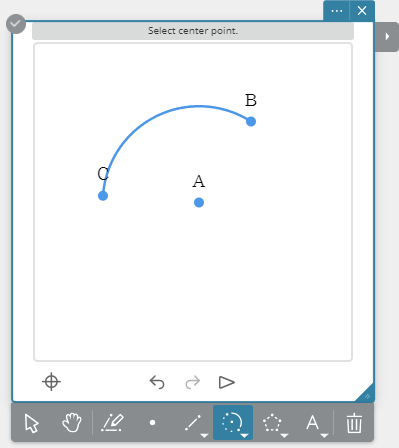
 Arc Arc |
|
|
1. Click the location you want to specify as the arc center point. 2. Click the location you want to specify as the arc start point. 3. Click the location you want to specify as the arc end point. ・An arc will be drawn from the start point to the end point, in a counterclockwise direction. |
 |
 Polygon Polygon |
|
|
1. Click the location you want to specify as a vertex of the polygon. 2. Click the locations you want to specify as the other vertices of the polygon. 3. To complete the polygon, click the location of the first vertex. |
 |
 Rigid Polygon Rigid Polygon |
|
|
Perform the same operation as when drawing a polygon. Note ・The shape of a rigid polygon cannot be changed by dragging a vertex or side. ・Dragging the initially specified vertex (A in the nearby illustration) moves the rigid polygon. ・Dragging the second specified vertex (B in the nearby illustration) rotates the rigid polygon on vertex A. |
 |
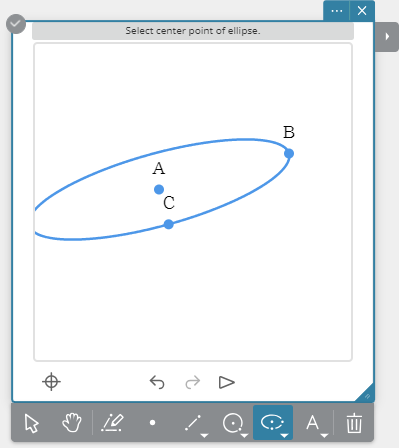
 Ellipse (Axes) Ellipse (Axes) |
|
|
1. Click the location you want to specify as the center point. 2. Click the location you want specify as the minor axis (closest point to the center point). 3. Click the location you want specify as the major axis (furthest point from the center point). ・You can also perform the above steps 2 and 3 in reverse sequence. |
 |
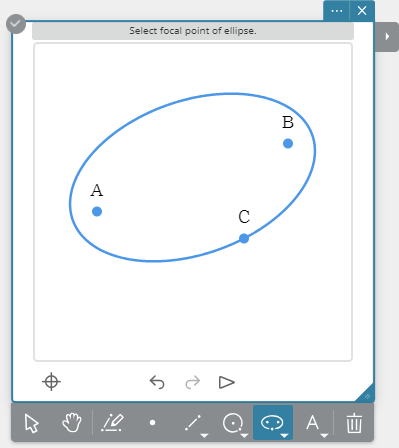
 Ellipse (Foci) Ellipse (Foci) |
|
|
1. Click two locations you want to specify as the foci. 2. Click the location you want to specify as any point on the ellipse periphery. |
 |
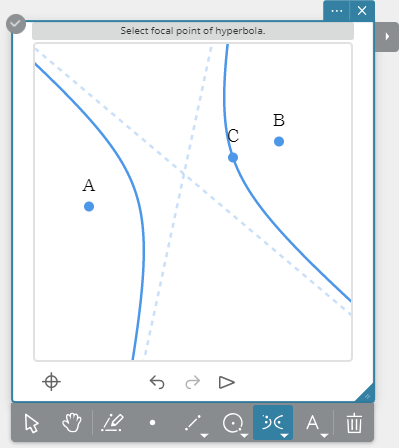
 Hyperbola Hyperbola |
|
|
1. Click two locations you want to specify as the foci. 2. Click the location you want to specify as any point on the hyperbolic curve. |
 |
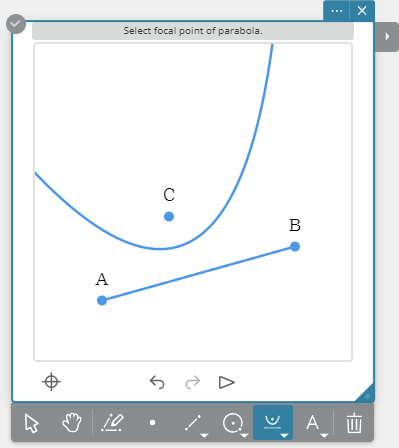
 Parabola Parabola |
|
|
1. Draw the line segment, straight line, ray, or vector to be used as the directrix of the parabola. 2. On the Object menu, click .3. Click the location you want to specify as the focus. 4. Click the directrix you drew in step 1. |
 |
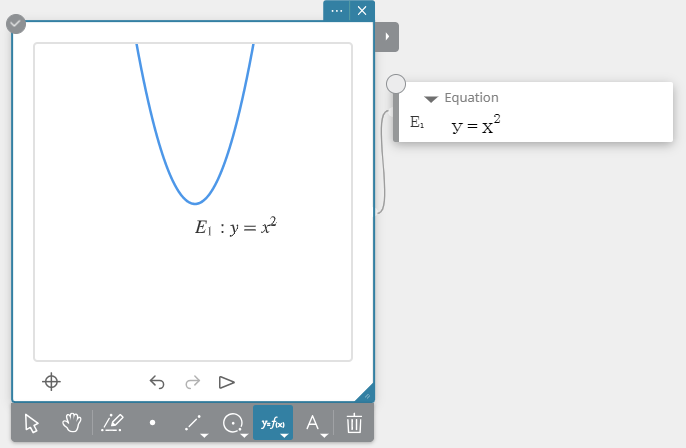
 Function Function |
|
|
1. On the Object menu, click . ・This displays an Equation Sticky Note. 2. Input a function into the Equation Sticky Note, and then click [EXE] on the soft keyboard. |
 |
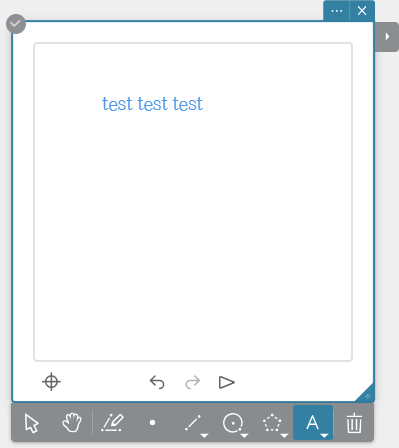
 Text Text |
|
|
1. On the Object menu, click . 2. Click the location where you want to insert text. ・This will display a text input box. 3. Input the text and then press [Enter] on your computer keyboard. |
 |
 Sketch Sketch |
|
|
This tool can be used for freehand drawing in the drawing area. The trajectory you draw is saved as an image and is automatically set as the background image for the Geometry Sticky Note. |
|
|
1. On the object menu, click . 2. Drag the mouse* to draw a trajectory. 3. To stop drawing, release the mouse button. ・Trajectories drawn from the point the mouse button is held down until it is released are saved individually as Background Image Sticky Notes (Sketch 1, Sketch 2, Sketch 3, etc.) |
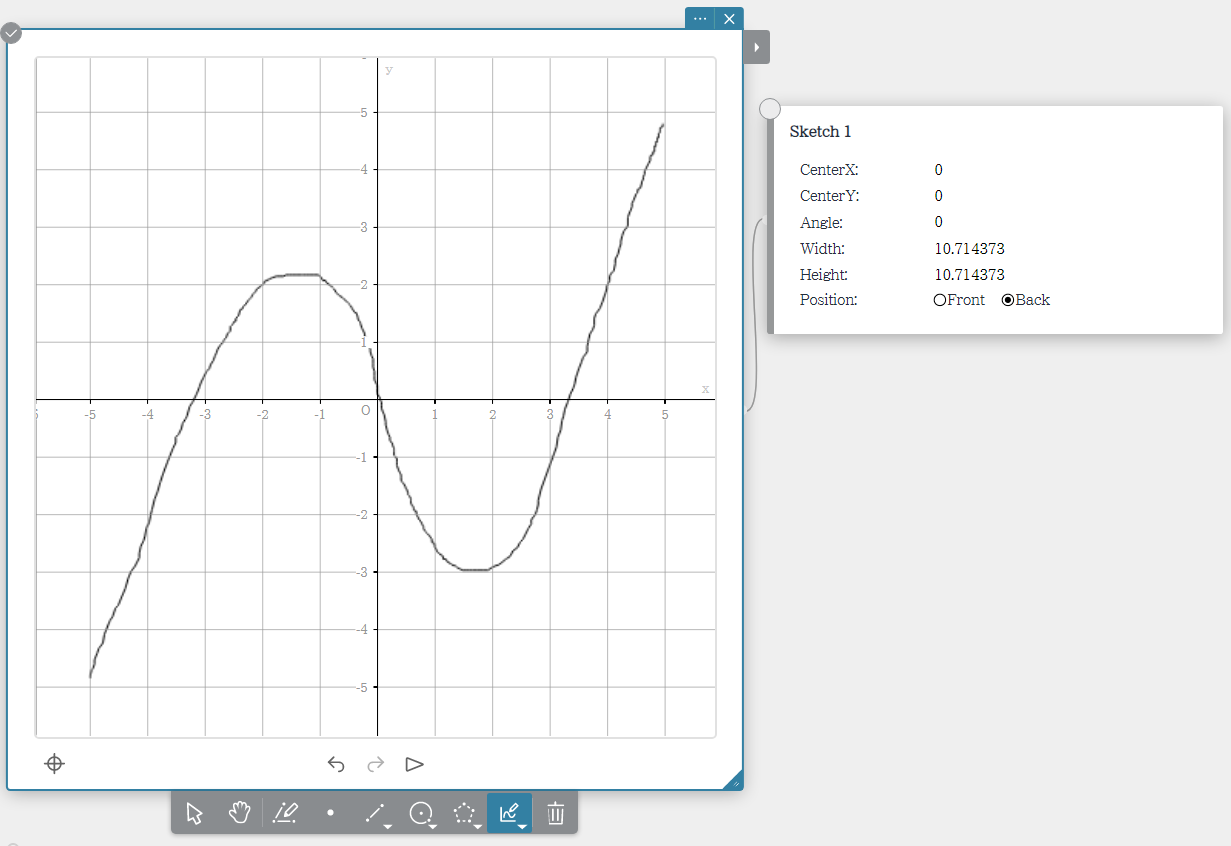 |
|
* If you are using a smartphone or tablet, trace trajectory on the screen with your finger. The trajectory you are tracing is drawn when you remove your finger from the screen. Note
|
|
5-30. Adjustment Functions
 Length Length |
|
|---|---|
|
1. Draw a line segment. 2. Select the line segment. 3. Click [Length/Distance]. ・The current length of the line segment is shown at the top of the Geometry Sticky Note. 4. Change the line segment length and then press [Enter] on your computer keyboard. Note ・This operation can be executed while a line segment, a vector, or one side of a polygon is selected. |
 |
 Congruent Congruent |
|
|
1. Draw a triangle. 2. Select two sides. 3. Click [Congruent]. Note ・The length of the second line you select is changed to match the length of the first line you selected in step 2. ・This operation can be executed while any two of the following items (two of the same type, or one each of different types) are selected: line segment, vector, or one side of a polygon. |
 |
 Parallel Parallel |
|
|
1. Draw two line segments. 2. Select the two line segments. 3. Click [Parallel]. Note ・The orientation of the second line you select is changed to match the orientation of the first line you selected in step 2. ・An arrow symbol (>) will appear on both lines when they are parallel with each other. ・Any two of the following items (two of the same type, or one each of different types) can be selected and made parallel with each other: line segment, straight line, ray, vector, or one side of a polygon. |
 |
 Perpendicular Perpendicular |
|
|
1. Draw two line segments. 2. Select the two line segments. 3. Click [Perpendicular]. Note ・The orientation of the second line you select is changed to make it perpendicular with the first line you selected in step 2. ・Any two of the following items (two of the same type, or one each of different types) can be selected and made perpendicular with each other: line segment, straight line, ray, vector, or one side of a polygon. |
 |
 Angle Angle |
|
|
1. Draw a triangle. 2. Select two sides. 3. Click [Angle]. ・This measures the angle between the selected two sides and displays it on the Angle Sticky Note. 4. Change the angle and then press [Enter] on your computer keyboard. Note ・The angle of the second line you select is changed based on the line segment you selected in step 2. ・This operation can be executed while any two of the following items (two of the same type, or one each of different types) are selected: line segment, straight line, ray, vector, or one side of a polygon. |
 |
 Regular Polygon Regular Polygon |
|
|
1. Draw an n-gon. 2. Select the n-gon. 3. Click [Regular Polygon]. ・This changes the figure to a regular n-gon. |
 |
5-31. Measurement Functions
 Angle Angle |
|
|---|---|
|
1. Draw a triangle. 2. Select two sides. 3. Click [Angle]. Note ・This operation can be executed while any two of the following items (two of the same type, or one each of different types) are selected: line segment, straight line, ray, vector, or one side of a polygon. |
 |
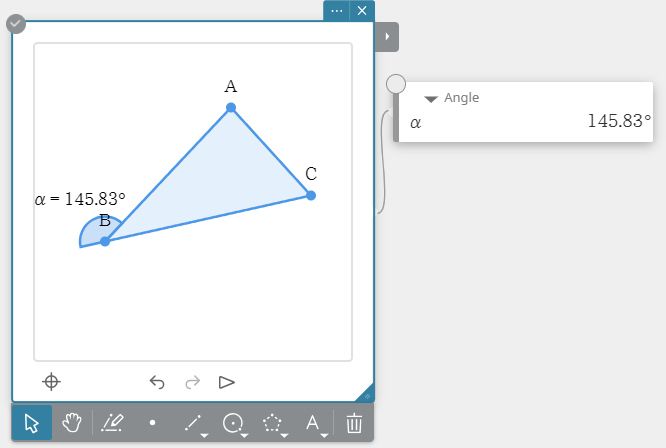
 Supplementary Angle Supplementary Angle |
|
|
1. Draw a triangle. 2. Select two sides. 3. Click [Supplementary Angle]. Note ・The position of the supplementary angle that is measured depends on sequence of the two sides you select in step 2. ・This operation can be executed while any two of the following items (two of the same type, or one each of different types) are selected: line segment, straight line, ray, vector, or one side of a polygon. |
 |
 Interior angle Interior angle |
|
|
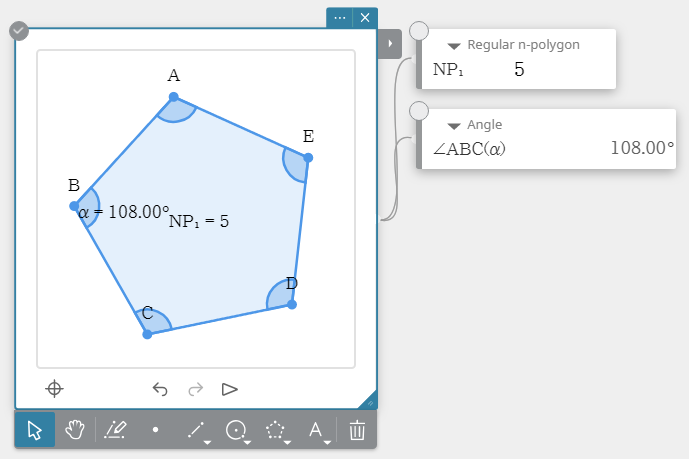
1. Draw a regular n-polygon. 2. Select the regular n-polygon. 3. Click [Interior angle]. |
 |
 Exterior angle Exterior angle |
|
|
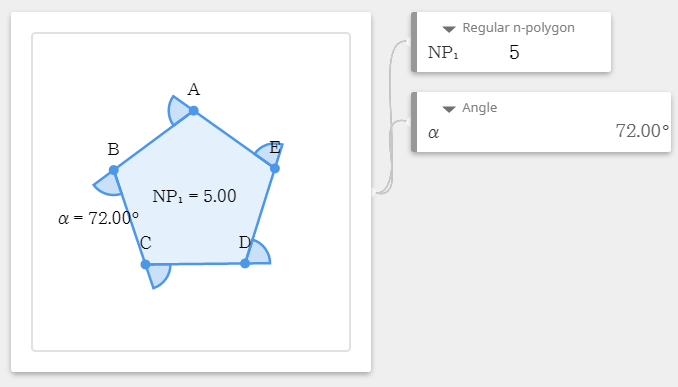
1. Draw a regular n-polygon. 2. Select the regular n-polygon. 3. Click [Exterior angle]. |
 |
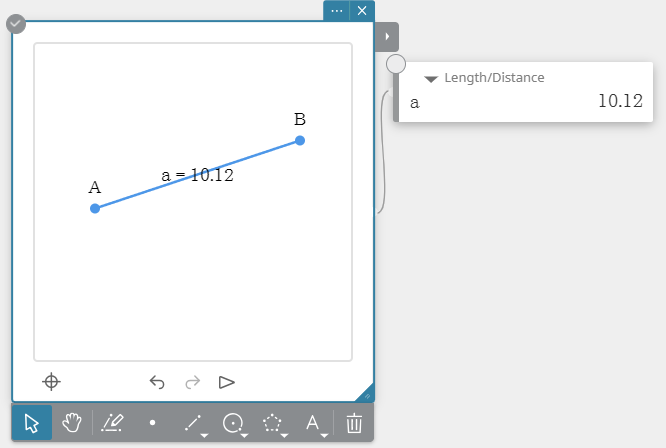
 Length/Distance Length/Distance |
|
|
1. Draw a line segment. 2. Select the line segment. 3. Click [Length/Distance]. Note ・This operation can be executed while any two points, a line segment, a vector, or one side of a polygon is selected. |
 |
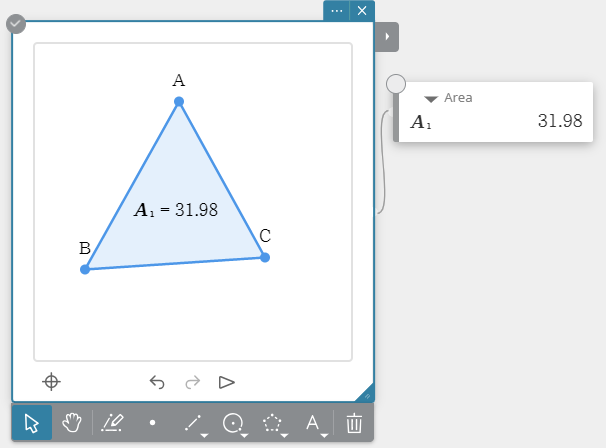
 Area Area |
|
|
1. Draw a triangle. 2. Select the triangle. 3. Click [Area]. Note ・This operation can be executed while a circle, ellipse, or polygon is selected. |
 |
 Circumference/Perimeter Circumference/Perimeter |
|
|
1. Draw a circle. 2. Select the circle. 3. Click [Circumference/Perimeter]. Note ・This operation can be executed while a circle, ellipse, or polygon is selected. |
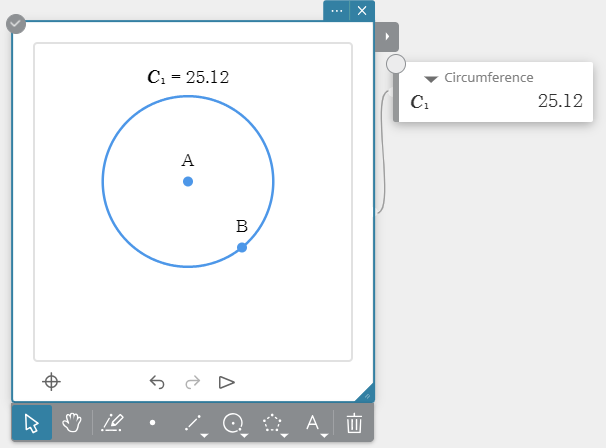 |
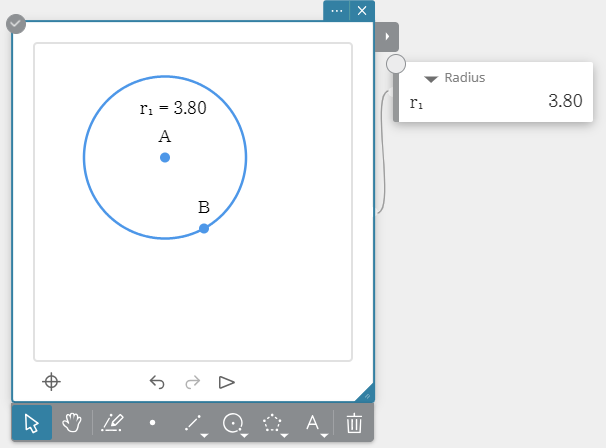
 Radius Radius |
|
|
1. Draw a circle. 2. Select the circle. 3. Click [Radius]. |
 |
 Slope Slope |
|
|
1. Draw a line segment. 2. Select the line segment. 3. Click [Slope]. Note ・This operation can be executed while a line segment, straight line, ray, vector, or one side of a polygon is selected. |
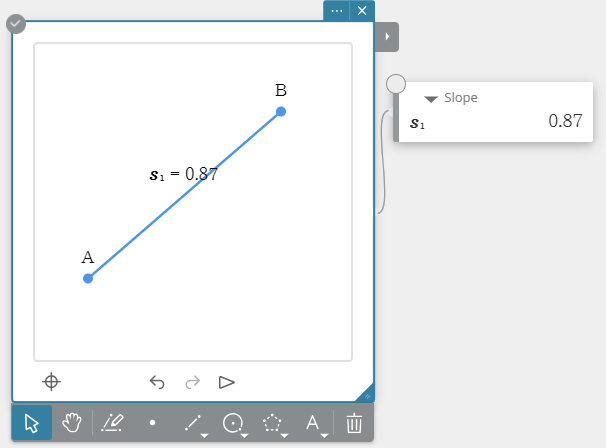 |
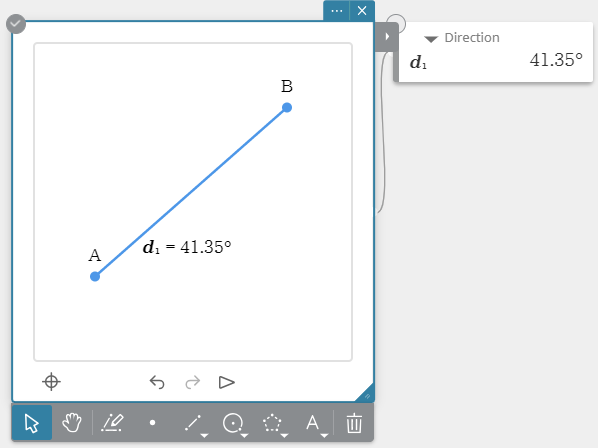
 Direction Direction |
|
|
1. Draw a line segment. 2. Select the line segment. 3. Click [Direction]. Note ・This operation can be executed while a line segment, straight line, ray, vector, or one side of a polygon is selected. |
 |
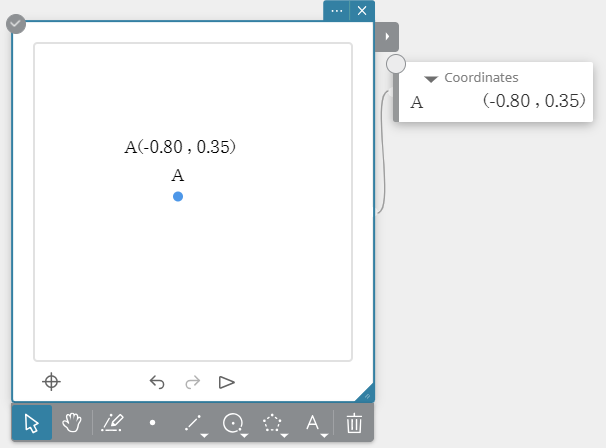
 Coordinates Coordinates |
|
|
1. Plot a point. 2. Select the point. 3. Click [Coordinates]. |
 |
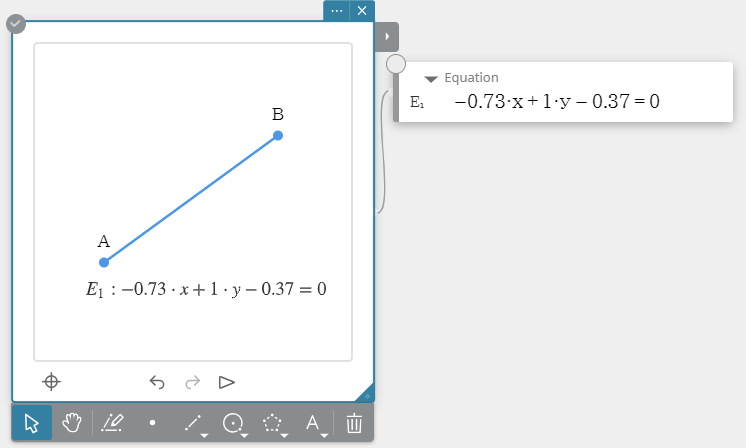
 Equation Equation |
|
|
1. Draw a line segment. 2. Select the line segment. 3. Click [Equation]. Note ・This operation can be executed while a line segment, straight line, ray, vector, circle, ellipse, or one side of a polygon is selected. |
 |
 Expression Expression |
|
|
1. Click [Expression]. 2. On the Expression Sticky Note, input the expression. 3. On the soft keyboard, click [EXE]. |
 |
5-32. Construction Functions
 Prep. Bisector Prep. Bisector |
|
|---|---|
|
1. Draw a line segment. 2. Select the line segment. 3. Click [Prep. Bisector]. Note ・This operation can be executed while one line segment, one side of a polygon, or two points are selected. |
 |
 Perpendicular Perpendicular |
|
|
1. Draw a line segment and plot a point. 2. Select the line segment and point. 3. Click [Perpendicular]. ・This will draw a perpendicular to the selected line segment that passes through the selected point. Note ・This operation can be executed while a single line segment and single point, a single line and single point, a single ray and a single point, a single vector and a single point, or one side of a polygon and a single point are selected. |
 |
 Midpoint Midpoint |
|
|
1. Draw a line segment. 2. Select the line segment. 3. Click [Midpoint]. ・This will construct the midpoint of the line segment you selected. Note ・This operation can be executed while one line segment, one side of a polygon, or two points are selected. |
 |
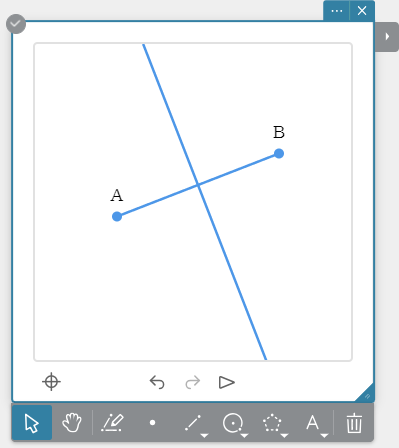
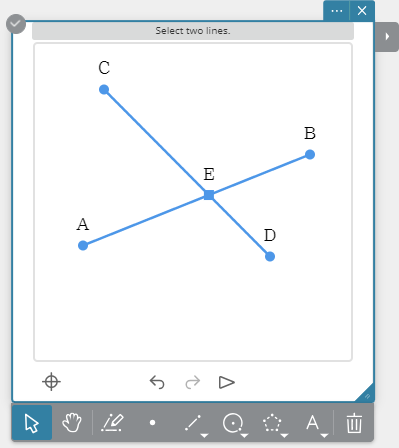
 Intersection Intersection |
|
|
1. Draw two intersecting line segments. 2. Select the two line segments. 3. Click [Intersection]. Note ・This operation can be executed while any two of the following items (two of the same type, or one each of different types) are selected: line segment, straight line, ray, vector, one side of a polygon, circle, arc, ellipse, hyperbolic curve, or parabola. |
 |
 Angle Bisector Angle Bisector |
|
|
1. Draw a triangle. 2. Select two sides. 3. Click [Angle Bisector]. Note ・This operation can be executed while any two of the following items (two of the same type, or one each of different types) are selected: line segment, straight line, ray, vector, or one side of a polygon. |
 |
 Parallel Parallel |
|
|
1. Draw a line segment and plot a point. 2. Select the line segment and point. 3. Click [Parallel]. Note ・Constructing parallel lines will cause arrow symbols (>) to appear on the two lines to indicate that they are parallel with each other. ・This operation can be executed while any combination of the objects below is selected.
- A single line segment and a single point, a single line and a single point, a single ray and a single point, a single vector and a single point
- One side of a polygon and a single point - A pair of lines (straight line, ray, vector, one side of a polygon, etc.) |
 |
 Tangent to Curve Tangent to Curve |
|
|
1. Draw a circle. 2. Select the circle. 3. Click [Tangent to Curve]. ・Starting with a point on the curve, this function constructs a straight line that passes through that point. ・The position of the straight line can be changed by dragging the point. Note ・This operation can be executed while a circle, ellipse, or function graph is selected. |
 |
 Regular n-polygon Regular n-polygon |
|
|
1. Draw a line segment. 2. Select the line segment. 3. Click [Regular n-polygon]. 4. Input the number of angles in the regular polygon you want to create in the Regular n-polygon Sticky Note. ・This will construct a regular polygon with the selected line segment as one side. |
 |
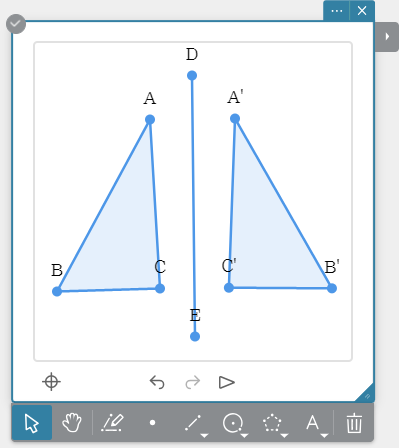
 Reflection Reflection |
|
|
1. Draw the figure that will be the basis of the reflection symmetry mapping and the line segment that will be the line of symmetry. 2. Select the figure that is the basis of the reflection symmetry mapping. 3. Click [Reflection]. 4. Select the line segment to use as axis of symmetry. ・This creates a reflection symmetry mapping of the original figure with the selected line segments as the axis of symmetry. Note ・You can specify a line segment, line, ray, or one side of a polygon as an axis of symmetry. |
 |
 Rotation Rotation |
|
|
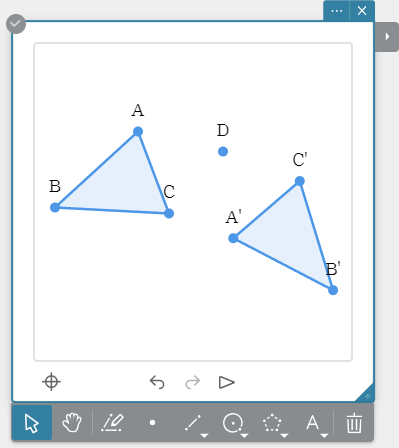
1. Draw a figure that will be the basis of the rotation mapping and plot a point as the rotation center. 2. Select the figure that will be the basis of the rotation mapping. 3. Click [Rotation]. 4. Select the rotation center point. 5. Input the angle of rotation (counterclockwise) as a degree value. ・This will create a figure that is the rotated version of the original figure. Note ・Inputting a variable for the rotation angle will display a slider. You can use the slider to view rotation of the figure as the variable value changes. |
 |
 Translation (Coordinates) Translation (Coordinates) |
|
|
1. Draw the figure that will be the basis of the translation mapping. 2. Select the figure. 3. Click [Translation (Coordinates)]. 4. Input a value to specify the amount of movement. ・This will create a mapping that is the translated version of the original figure. Note ・Inputting a variable for the amount of movement will display a slider. You can use the slider to view translation of the figure as the variable value changes. |
 |
|
Translation (Vector) |
|
|
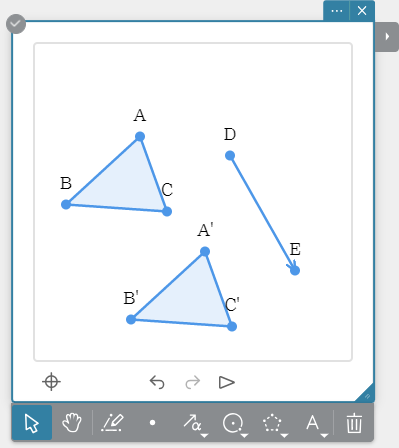
1. Draw the figure that will be the basis of the translation mapping. 2. Draw a vector for specification of parallel translation and direction. 3. Select the figure you drew in step 1. 4. Click [Translation (Vector)]. 5. This displays the message "Select vector." Click the vector that you draw in step 2. • This will create a mapping that is the translated version of the original figure. |
 |
 Dilation Dilation |
|
|
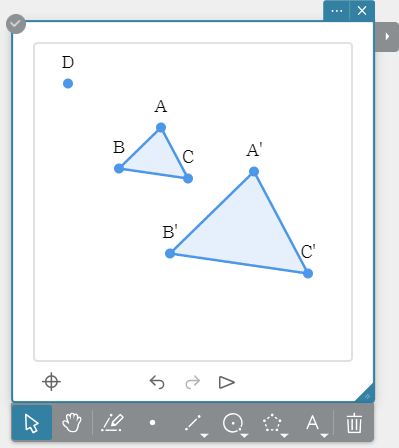
1. Draw a figure to be dilated. 2. Plot a point as the dilation center. 3. Select the figure to be dilated. 4. Click [Dilation]. 5. Select the dilation center point. 6. Input the dilation factor. • This will draw a resized version of the original object. Note
|
 |
 Compass Compass |
|
|
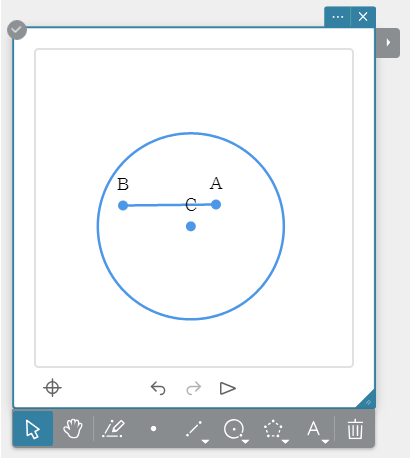
1. Draw a line segment. 2. Select the line segment. 3. Click [Compass]. ・This will construct a circle whose radius is the length of the selected line segment. Note ・You can execute construction of a circle while one line segment or two points are selected. ・Changing the length of a line segment will change the size of the circle linked with it. |
 |