6. Sequence
6-1. Sequence Calculation Basic Operations
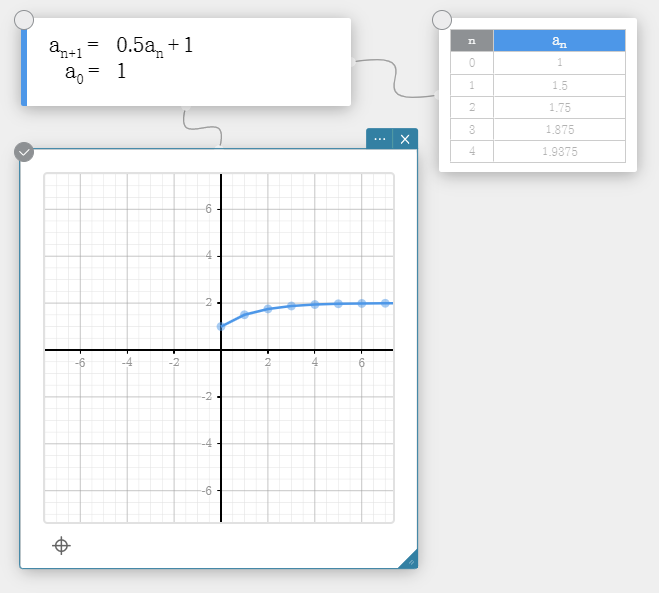
Example: To input the recursive formulas $a_{n+1} = 0.5 a_{n} + 1$ , $a_{0} = 1$, create a number table, and draw a graph
1. Click anywhere on the Paper.
• This displays the Sticky Note menu.
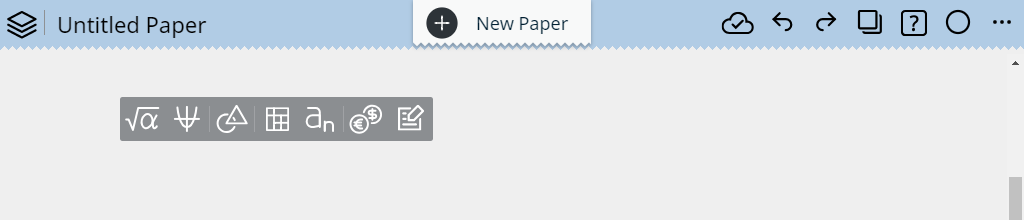
2. Click  .
.
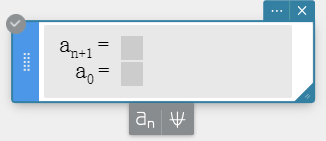
• This creates a Sequence Sticky Note.
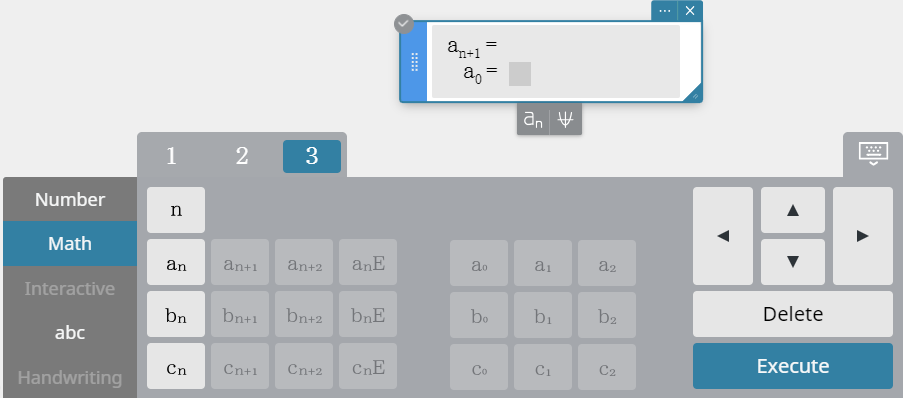
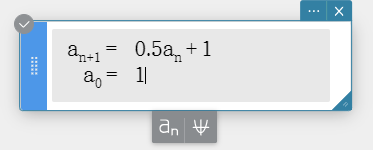
3. In the $a_{n+1} =$ (recursive formula) field, input $0.5 a_{n} + 1$. In the $a_{0} =$ (first term) field, input $1$
• You can use the [Math] keyboard's [3] tab to input $a_{n}$ and $a_{0}$.
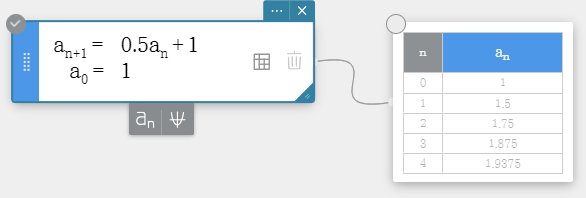
4. On the soft keyboard, click [Execute].
• This creates a Sequence Table Sticky Note and displays its $a_{n}$ sequence table.
5. Click  to display a graph.
• This draws the graph that is the basis of the $a_{n}$ Sequence Table Sticky Note.
6-2. Changing the Sequence Calculation Type
1. Create a Sequence Sticky Note.
2. Click the Menu button ( ).
).
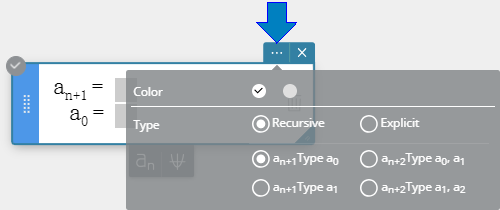
3. On the menu that appears, click the sequence calculation type you want to select.
Note
- You can select one of the sequence calculation types below.
- Recursive - $a_{n+1}$ Type $a_{0}$
- Recursive - $a_{n+1}$ Type $a_{1}$
- Recursive - $a_{n+2}$ Type $a_{0}, a_{1}$
- Recursive - $a_{n+2}$ Type $a_{1}, a_{2}$
- Explicit
- A calculation type change using the above operation is applied to the changed Sequence Sticky Note only.
- The values of the following variables are retained even if the sequence calculation type is changed: $a_{n+1},~ a_{n+2},~ a_{n}{\rm E},~ a_{0},~ a_{1},~ a_{2}$.
6-3. Performing Multiple Sequence Calculations
6-3-1. To input multiple equations
1. Click an existing Sequence Sticky Note to select it.
2. At the bottom of the Sequence Sticky Note, click  .
.
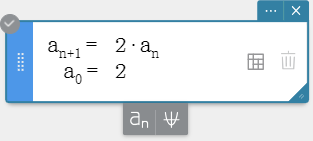
• This adds a new Sequence Sticky Note.
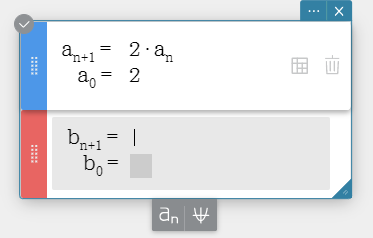
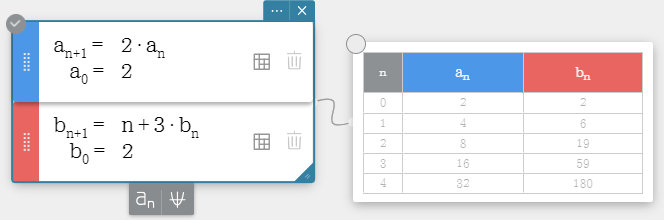
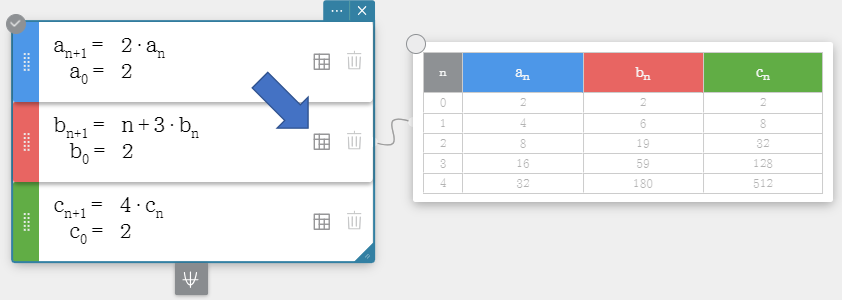
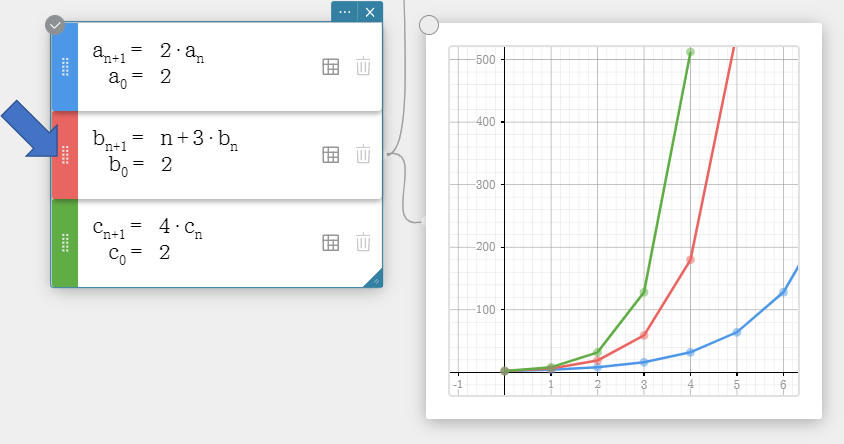
3. In the $b_{n+1} =$ (recursive formula) field, input $n + 3 * b_{n}$. In the $b_{0} =$ (first term) field, input $2$ .
4. On the soft keyboard, click [Execute].
• This adds a numeric sequence (column $b_{n}$) to the Sequence Table Sticky Note.
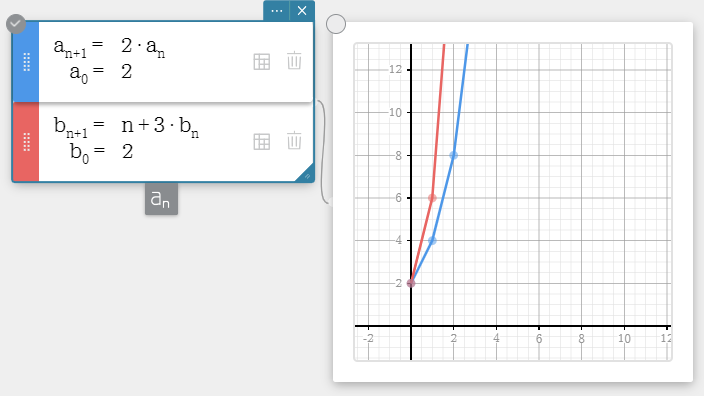
5. Click  .
.
• This overwrites the existing graph with the graph based on column $b_{n}$ of the Sequence Table Sticky Note.
Note
- You can add up to three Sequence Sticky Notes.
- When there are multiple Sequence Sticky Notes, they can be rearranged as required.
- Multiple Sticky Notes cannot be separated. *
- * Some Sticky Notes can be separated, while some cannot. For information about separating a Sticky Note, see "1-10. Separating Combined Sticky Notes".
6-3-2. To delete a particular equation
1. Click the Sequence Sticky Note to select it.
2. Click the Delete button ( ) of the equation you want to delete.

• This deletes the selected equation.
6-4. Configuring Sequence Table Settings
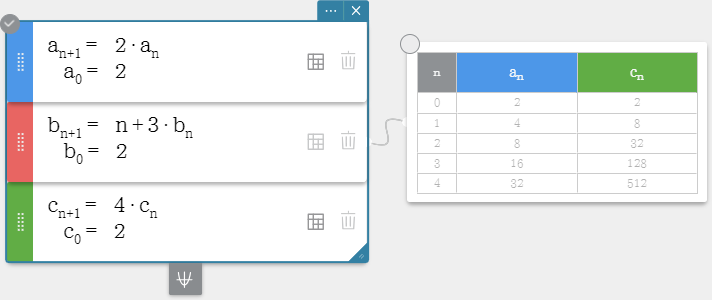
6-4-1. To hide a particular sequence table
1. Click  on the Sequence Sticky Note of the sequence table you want to hide.
・ This hides the sequence table of the equation you selected.
・To re-display the sequence table, click  again.
6-4-2. To configure the display settings of a sequence table
1. Click the sequence table's Menu ( ) button.
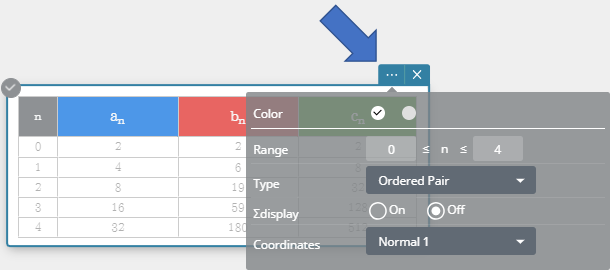
2. On the menu that appears, configure the settings below.
- Range: Specifies the range of values for variable n in this sequence table.
- Type: Specifies the sequence calculation type to be applied to this sequence table.
- Σdisplay: Turn display of sequence table subtotals on or off.
- The items shown below are displayed in the sequence table in accordance with what is specified for Type and Σdisplay.
-
-
Recursive Explicit Type\Σdisplay On Off On Off Ordered Pair n, an, Σan n, an n, anE, ΣanE n, anE Arithmetic n, an, Σan n, an, Dfrn n, anE, n, anE, Dfrn Sequence Dfrn ΣanE, Dfrn Geometric Sequence n, an, Σan, Quot n, an, Quot n, anE, ΣanE, Quot n, anE, Quot Progression of Difference n, an, Σan, Dfrn, Quot n, an, Dfrn, Quot n, anE, ΣanE, Dfrn, Quot n, anE, Dfrn, Quot Fibonacci Sequence n, an, Σan, Sum n, an, Sum n, anE, ΣanE, Sum n, anE, Sum
-
- Coordinates: Specifies the number of sequence table display digits. For information about the selected coordinates option (Normal 1, Normal 2, Fix 0 to Fix 9, Sci 0 to Sci 9) and the number of digits, see "Number Format" under "2-14. Configuring Calculation Settings".
Note
- The meanings of the abbreviations used in the table (Dfrn, Quot, Sum) are shown below.
- Dfrn: Arithmetic sequence (Difference)
- Quot: Geometric sequence (Quotient)
- Sum: Fibonacci sequence
6-5. Configuring Graph Settings
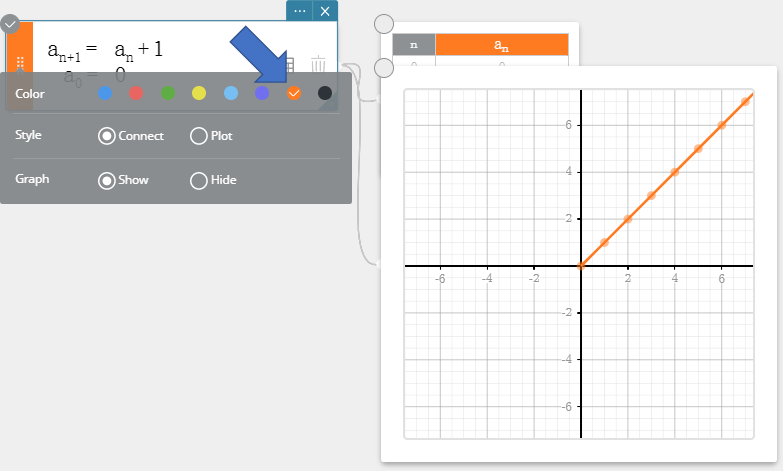
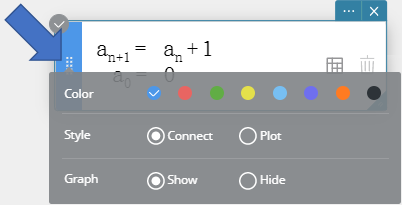
6-5-1. Changing the color of a Graph
1. Click the drag handle ( ) of the Sequence Sticky Note.
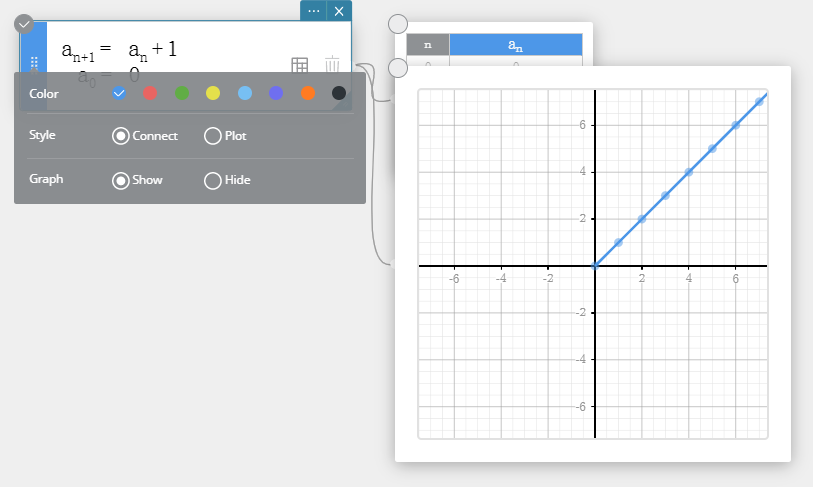
2. On the Color Palette, select the desired color to change the graph color.
6-5-2. To change the graph drawing type
1. Click the drag handle ( ) of the Sequence Sticky Note.
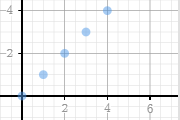
2. You can select one of the graph drawing types below.
Connect ... Connects points with a line.
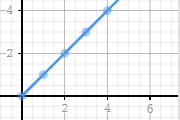
Plot ... Plots points without connecting them.
6-5-3. To hide the graph of a particular equation
1. Click the drag handle ( ) of the Sequence Sticky Note whose graph you want to hide.
2. Click [Hide].
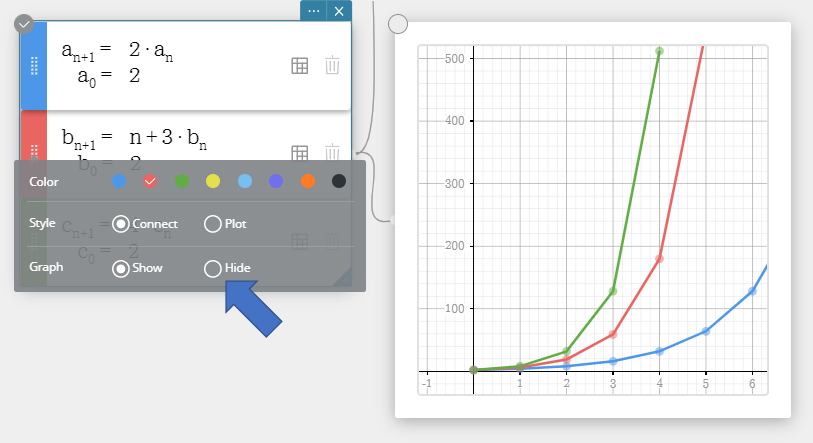
・This hides the graph of the selected equation.
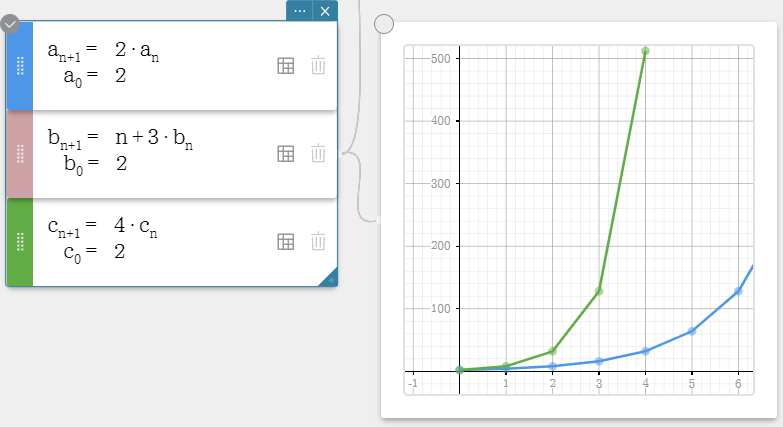
・To re-display the graph, click [Show].
6-5-4. To configure graph display settings
1. Click the Graph Sticky Note's Menu ( ) button.
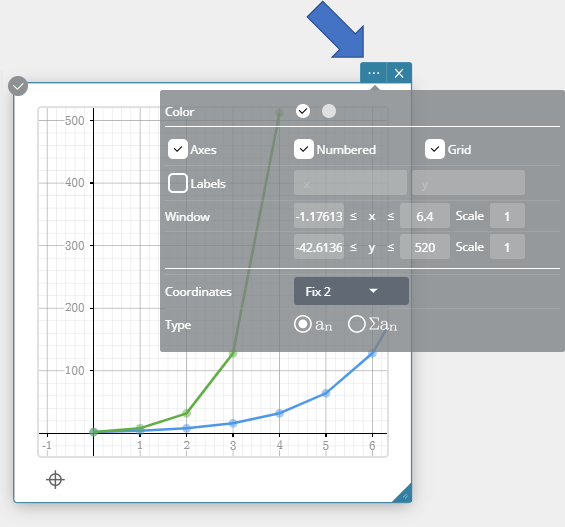
2. On the menu that appears, configure the settings below.
-
Axes: Select this check box to show the coordinate axes in the draw area. Numbered: Select this check box to show the coordinate axes and tick marks in the draw area. To be able to select this check box, you first need to select the" Axes" check box. Grid: Select this check box to show a grid in the draw area. Labels: Select this check box to show coordinate axis names on the graph. You can change an axis name if you want. Window: X: Specifies the display range of the x-axis. X Scale: Specifies interval between tick marks on the x-axis. Y: Specifies the display range of the y-axis. Y Scale: Specifies interval between tick marks on the y-axis. Coordinates: Specifies the number of coordinate value display digits. For information about the selected coordinates option (Normal 1, Normal 2, Fix 0 to Fix 9, Sci 0 to Sci 9) and the number of digits, see "Number Format" under "2-14. Configuring Calculation Settings". Type: Specifies the data to be plotted.
$a_{n}$ : Plots $a_{n}$ values. $\Sigma a_{n}$ : Plots $\Sigma a_{n}$ values.