
A Color Graph sticky note is a scientific calculator emulator that allows you to use the same functions and operations as an actual scientific calculator (hardware).
MEMO
This page describes Color Graph sticky notes. For how to operate ClassWiz sticky notes, refer toClassWiz sticky note (scientific calculator emulator).
This section describes the basic operations on Color Graph sticky notes. For the detailed functions and operations, refer to the ClassWiz scientific calculator user’s guide.
Web search page for CASIO scientific calculator manuals
The operation and calculation speeds of Color Graph sticky notes are dependent on factors such as the processing speed of your computer or tablet, your browser’s performance, and your network environment, and may differ from an actual calculator.
table of contents
How to start a Color Graph sticky note
How to operate a Color Graph sticky note
Capturing the calculation screen image (Image Capture sticky note)
Displaying the key log (Key Log sticky note)
Importing/exporting files
How to start a Color Graph sticky note
- Select
 in the sticky note menu.
 - Select one of the following from the model selection list.
・GRAPH MATH+
・fx-CG100
・fx-1AU GRAPH - The Color Graph sticky note is displayed.
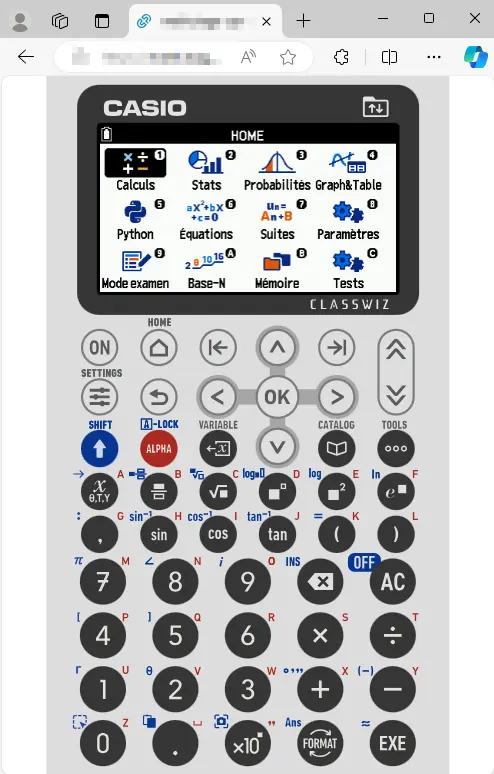
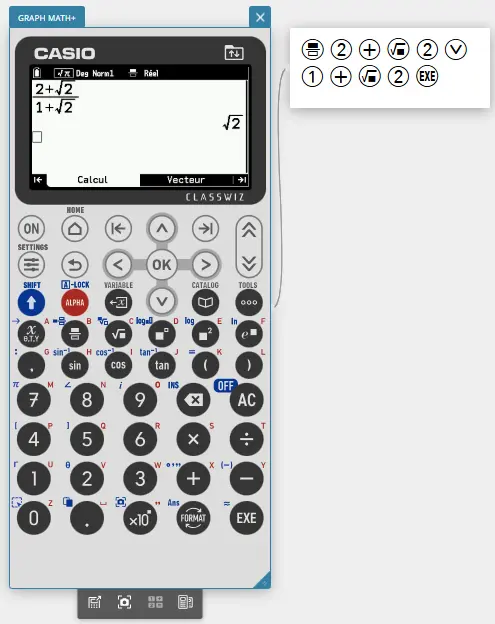
How to operate a Color Graph sticky note
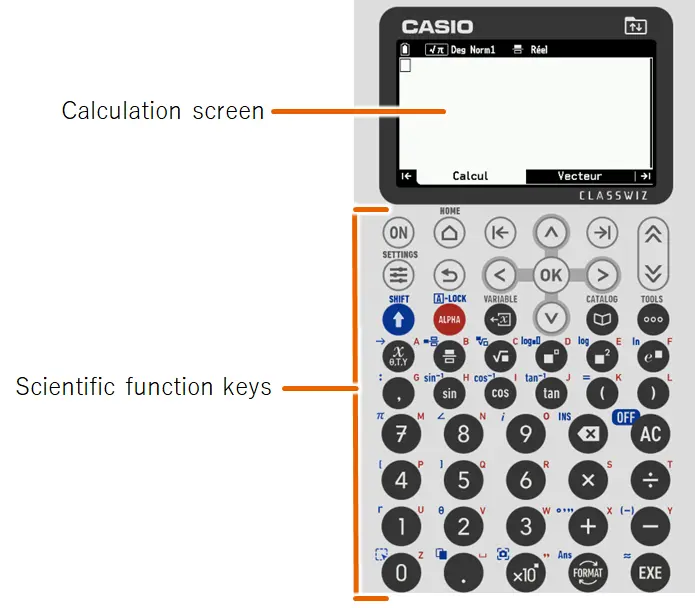
Click keys on the Color Graph sticky note to enter numbers, functions, etc.
You can also use your computer keyboard to enter data.
Example
| Color Graph sticky note key | Keyboard key |
|---|---|
| AC | Tab |
| ON | Insert |
| HOME | Home |
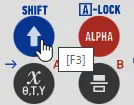
| SHIFT | F3 |
| ALPHA | F4 |
| CATALOG | F6 |
| Tools | F7 |
| = / EXE | Enter |
| DEL | Delete Back Space |
| + - × ÷ | + - * / |
| . / , | .(period) ,(comma) |
| 0 – 9 | 0 - 9 |
MEMO
Hover the mouse cursor over each key on the Color Graph sticky note to display the corresponding keyboard key.
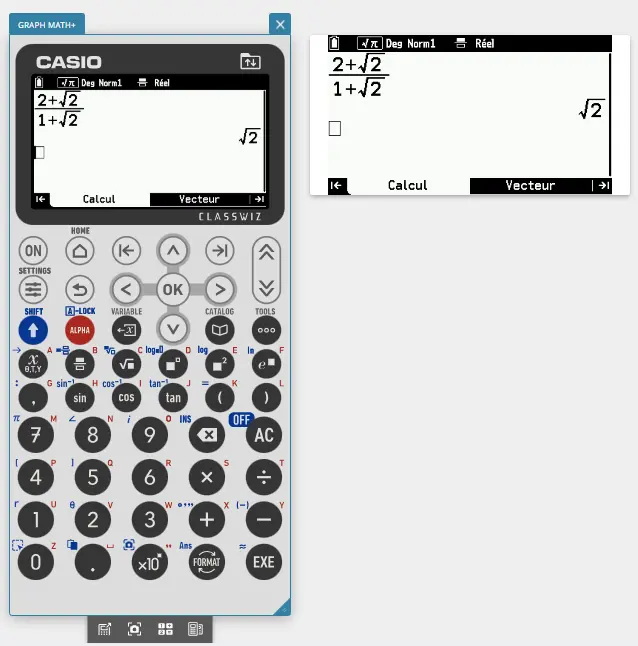
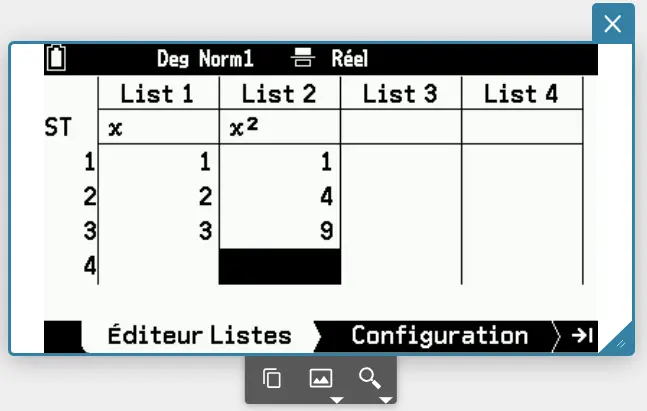
Capturing the calculation screen image (Image Capture sticky note)
Capture the currently displayed calculation screen image to place it on the Paper as a standalone sticky note (Image Capture sticky note).
- To capture the calculation screen image:
- Use the Color Graph sticky note to display the calculation screen you want to capture.
- Click
 on the tool palette.
This captures the currently displayed calculation screen and creates an Image Capture sticky note.The image is also copied to the clipboard at the same time.
- Repeat steps 1 and 2 above as many times as needed to create multiple Image Capture sticky notes.
You can create up to 100 Image Capture sticky notes.
MEMO
An Image Capture sticky note remains undeleted even if its source Color Graph sticky note is closed.
- Image Capture sticky note tool palette
Select an Image Capture sticky note to display the tool palette.
The table below shows the icons and their function.
| Icon | Function |
|---|---|
 |
Copies the captured screen image to the clipboard. |
 |
Specifies whether or not to place a frame around the captured image copied to the clipboard when is selected. On: Places a frame Off: Does not place a frame |
 |
Specifies the display size of the Image Capture sticky note (and the size of the captured image that is copied to the clipboard when is selected).※ ×1: Actual size (194×73 pixels) ×2: Double size ×3: Triple size |
※ You can also drag in the bottom right corner of the sticky note to change the image size.
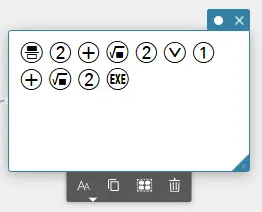
Displaying the key log (Key Log sticky note)
A Key Log sticky note displays the input history (key log) of a Color Graph sticky note.
- To create a Key Log sticky note:
- Select a Color Graph sticky note.
- Select
 on the tool palette.
This creates a Key Log sticky note linked with the selected Color Graph sticky note.
MEMO
Deleting a Color Graph sticky note also deletes the linked Key Log sticky note at the same time.
- Key Log sticky note tool palette
Select a Key Log sticky note to display the tool palette.
The table below shows the icons and their function.
| Icon | Function |
|---|---|
 |
Specifies the text (key) display size. |
|
Copies the text (keys) in the selected range. Copied content can be pasted into a Text sticky note or into another app※. |
 |
Selects all the text (keys) in the Key Log sticky note. |
 |
Deletes all the text (keys) in the Key Log sticky note. |
※If you paste the content of a Key Log sticky note into another app, a dedicated font must be installed on your computer for the text (keys) to display correctly. For details, see here.
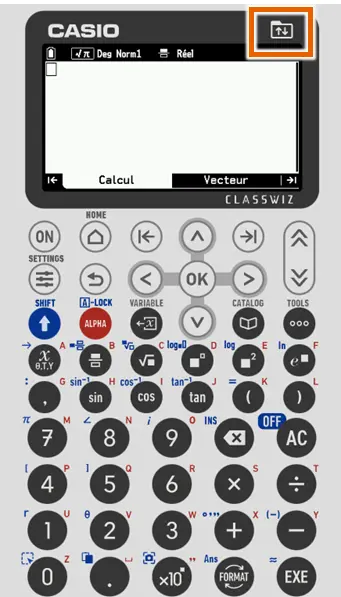
Importing/exporting files
You can import files stored on your computer or tablet to a Color Graph sticky note. You can also export files stored in the memory for a Color Graph sticky note to your computer or tablet.
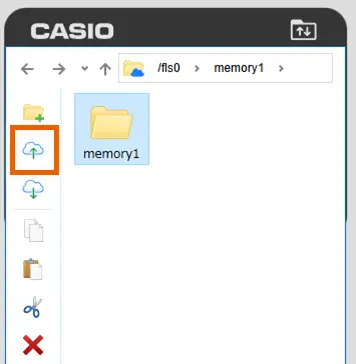
- Importing
Import files from your PC or tablet to a Color Graph sticky note.
- Select
 from the scientific calculator screen.
- Select
 .
.
- Select and import a file.
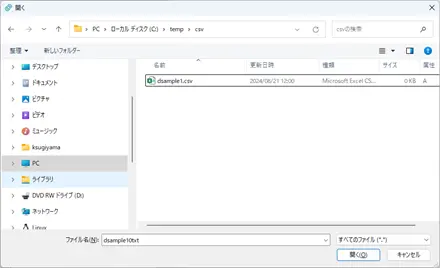
- The imported file is displayed in the Color Graph sticky note.
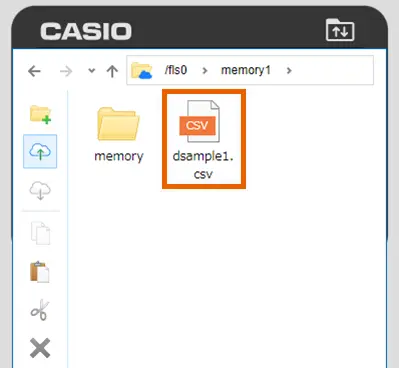
- Select to return to the scientific calculator screen.
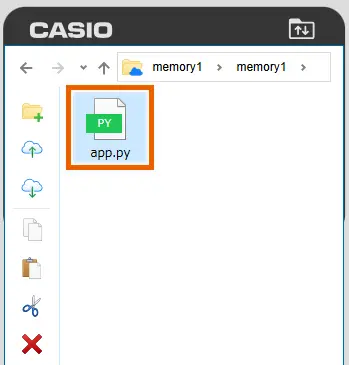
- Exporting
Save files stored in a Color Graph sticky note on your computer or tablet.
- Select from the scientific calculator screen.
- Select a file you want to export.
- Select
 .
.
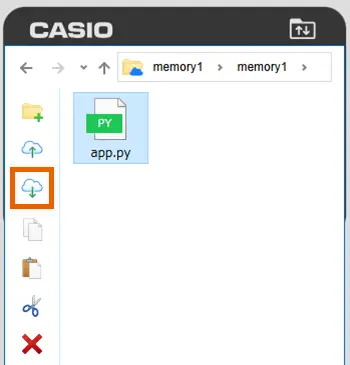
- The file is downloaded.
Files are downloaded by using the capability of your browser. The location where downloaded files are saved depends on your device settings. - Select to return to the scientific calculator screen.